
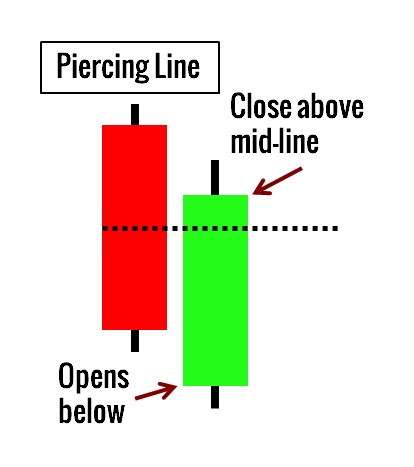
The Piercing Pattern candlestick is composed of a two-candle formation in a downtrend. Where the first candle will be the Red continuation of the downtrend. And second-day candle is formed by opening below the low of the previous day. It closes more than midway up the Red candle (previous candle), near or at the high for the day.
A piercing line candlestick is used as a bullish signal. More buying the next day will confirm the move.
How to identify a Bullish Piercing Line pattern
- The body of the first candle should be Red and the body of the second candle should be Green.
- The stock trends should be a downtrend.
- The second day opens lower than the trading of the prior day.
- The Green candle closes more than halfway up the black candle.
Strong Trend Reversal chances with Piercing Line candlestick
- The longer the Red candle and the Green candle, the more forceful the reversal.
- The greater the gap down from the previous day’s close, the more pronounced the reversal.
- The higher the Green candle closes into the Red candle.
- Large volume.
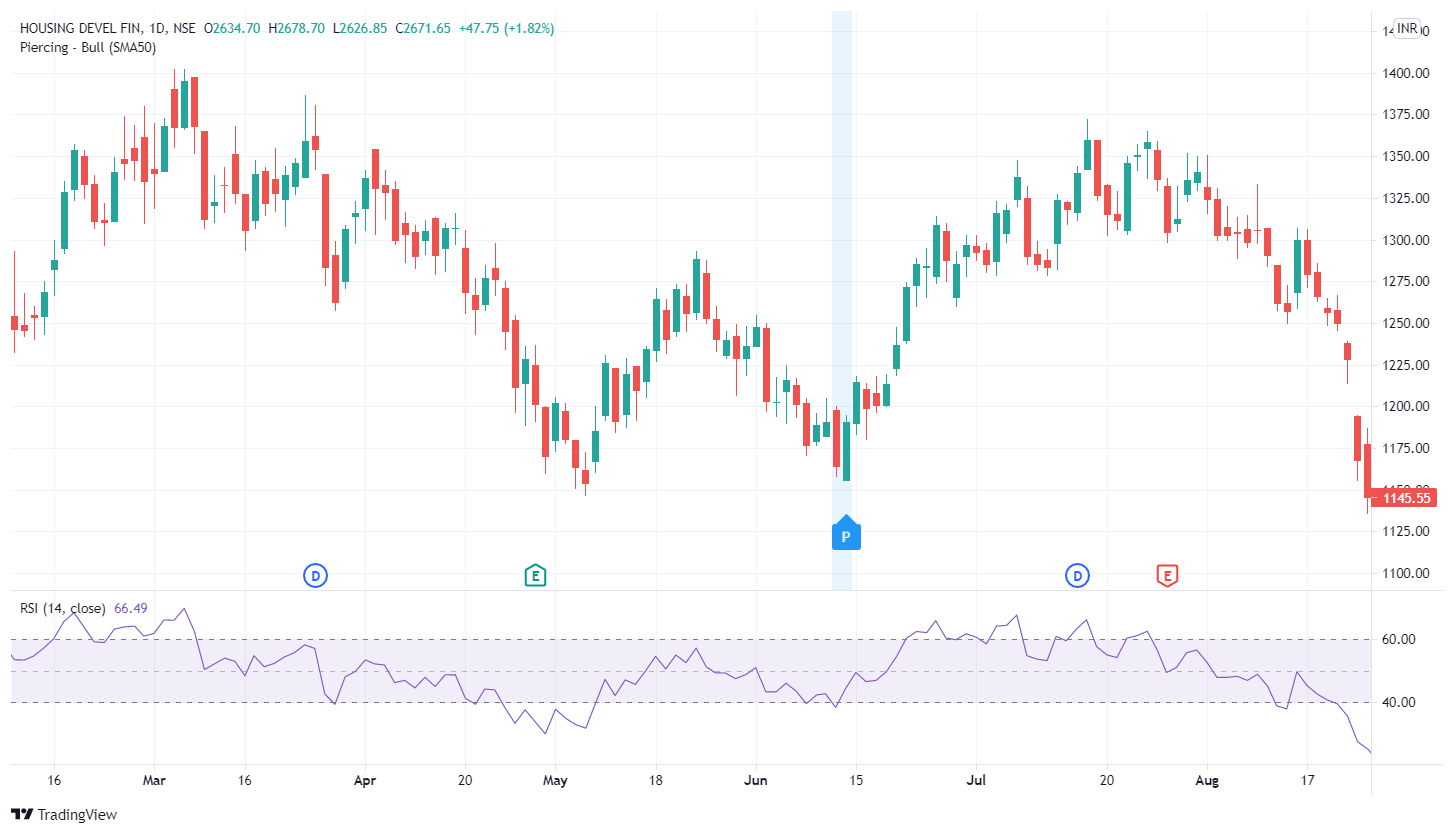
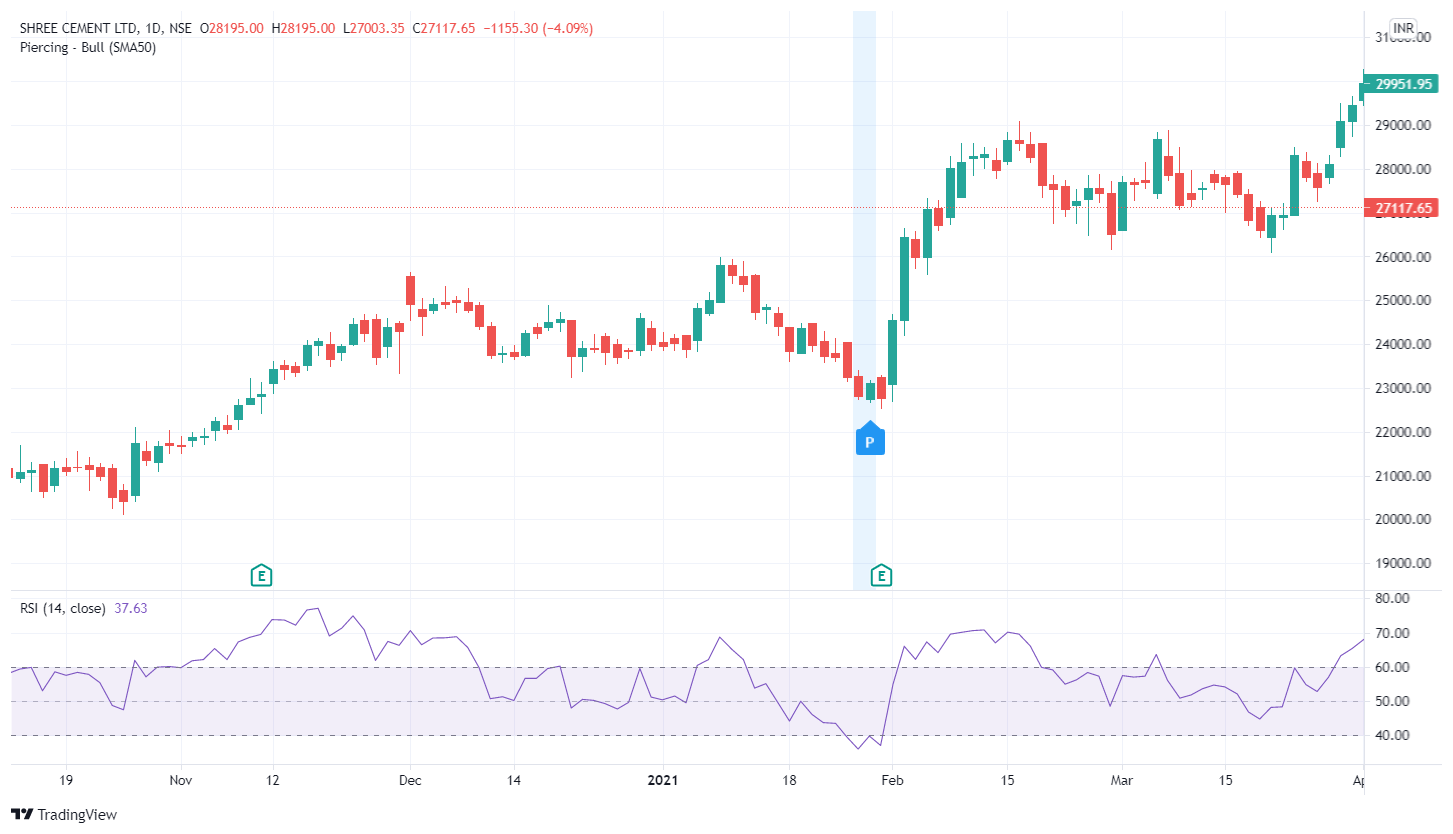
Charts Show Piercing line candlestick pattern
Click on images to zoom in.
The reversal of trend with Piercing patterns higher than Hammer, Handing man, Doji, and Engulfing Candle
Disclaimer: All comapny chart are used only for learing purpose. There is no buy and sell recommandtion. All Technical analyst are learing purpose only.