
Trendline trading is a popular strategy used by traders to identify trends and potential trading opportunities in the market. Different types of trendlines, such as upward, downward, horizontal, and trend channels, can be used to identify key support and resistance levels and help traders make buying or selling decisions.
There are different types of trendlines:
It involves drawing lines on a chart to connect the highs or lows of an asset’s price over time, creating a visual representation of the trend.
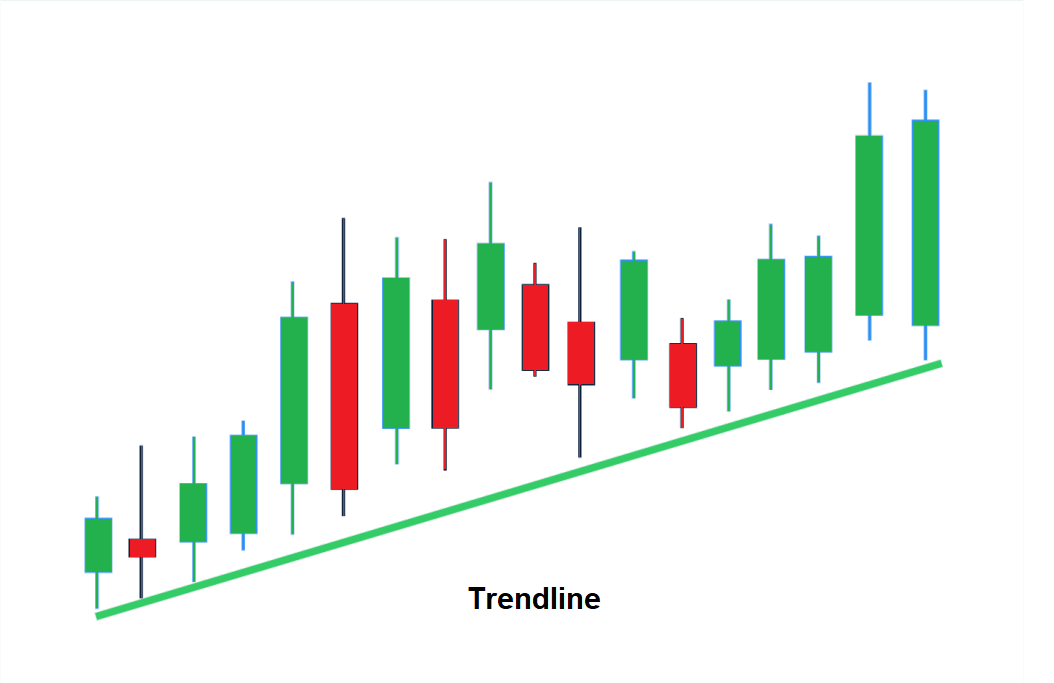
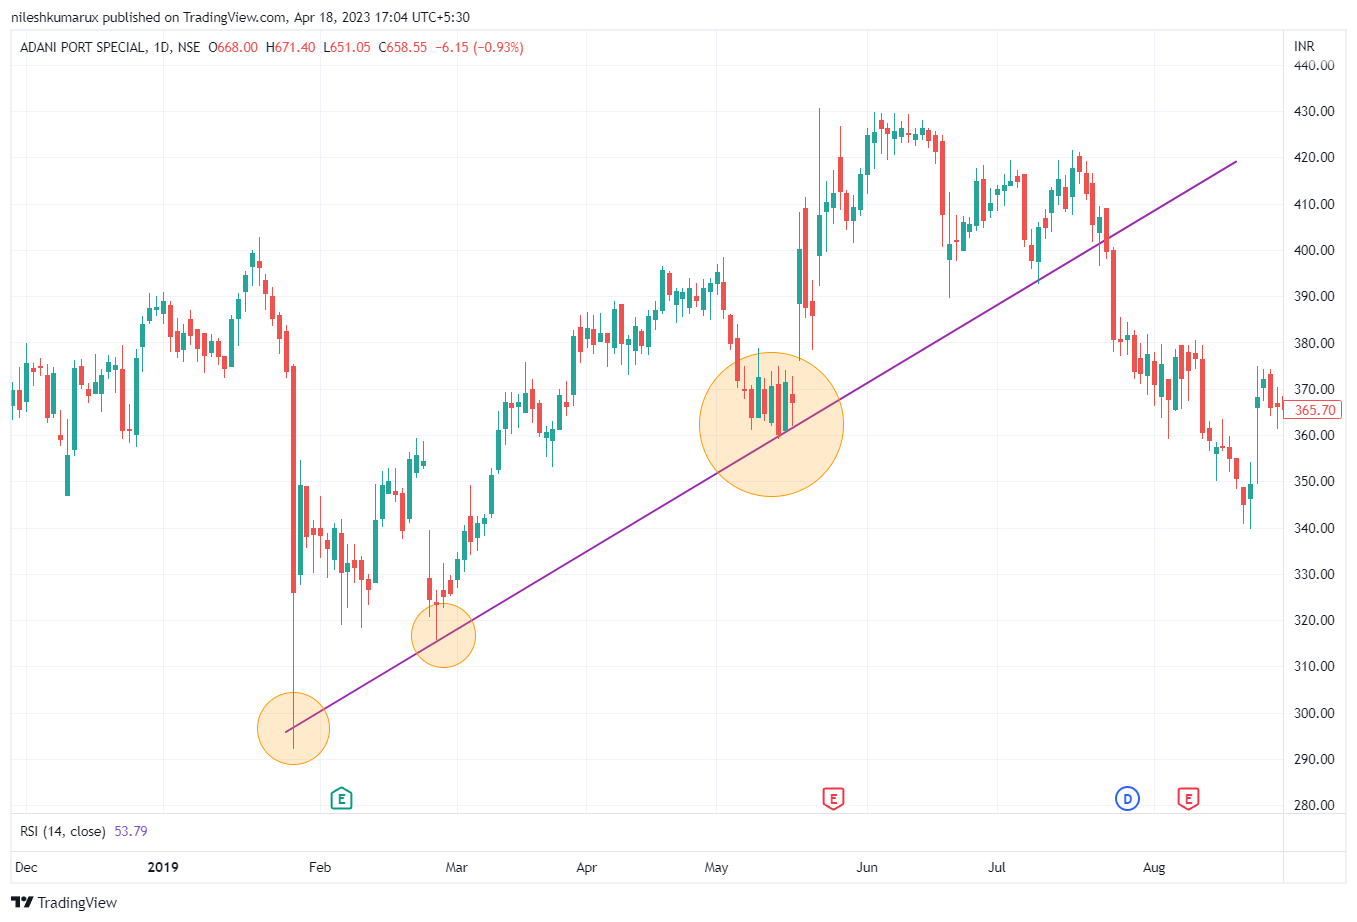
- Upward trendlines: To draw an upward trendline, connect the lows that are progressively higher during an uptrend. Traders may use an upward trendline to identify potential buying opportunities when the price approaches or touches the trendline.
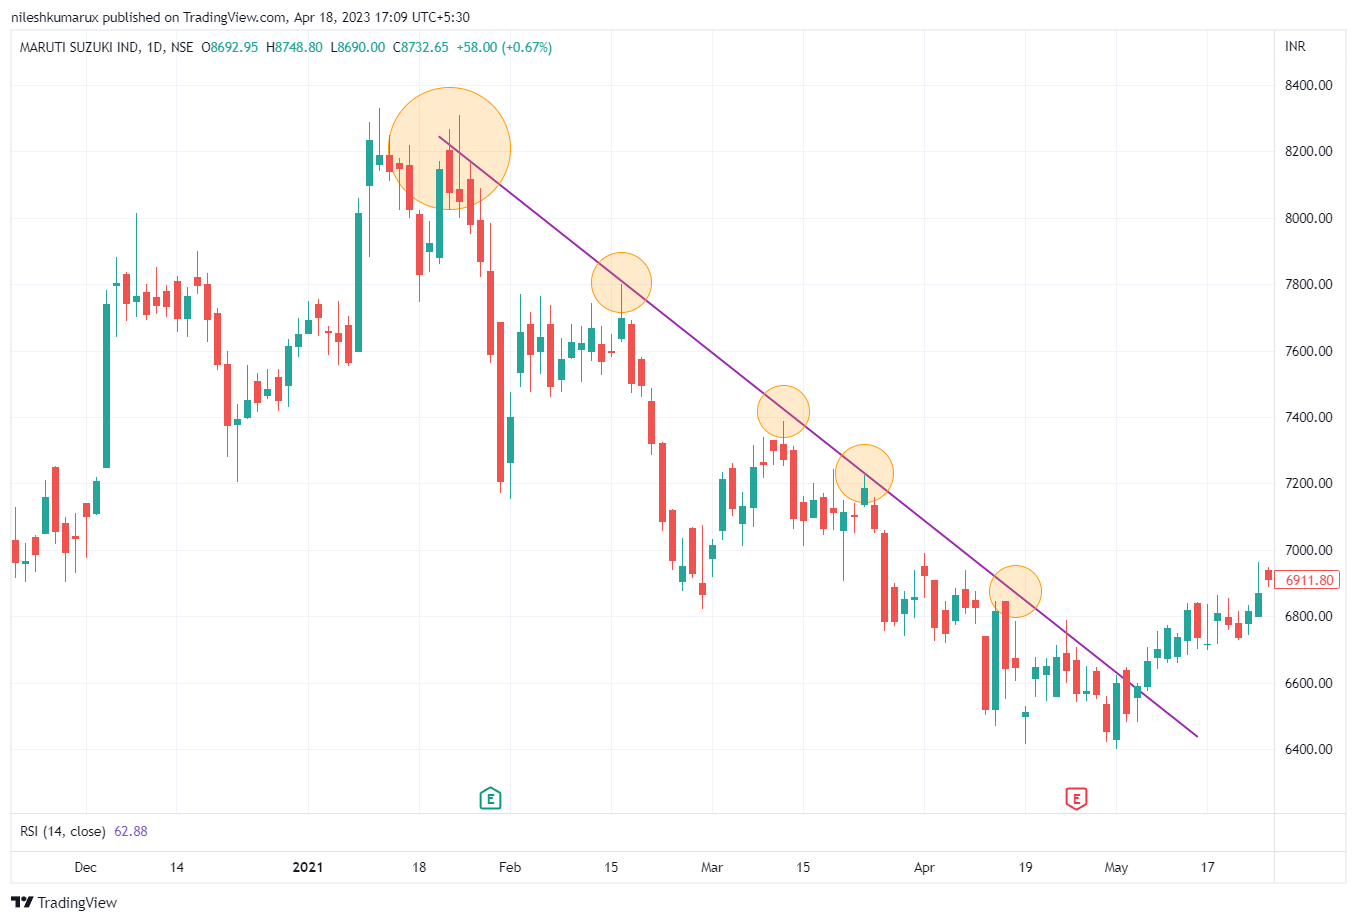
- Downward trendlines: To create a downward trendline, connect the highs that are progressively lower during a downtrend. Traders may use a downward trendline to identify potential selling opportunities when the price approaches or touches the trendline.
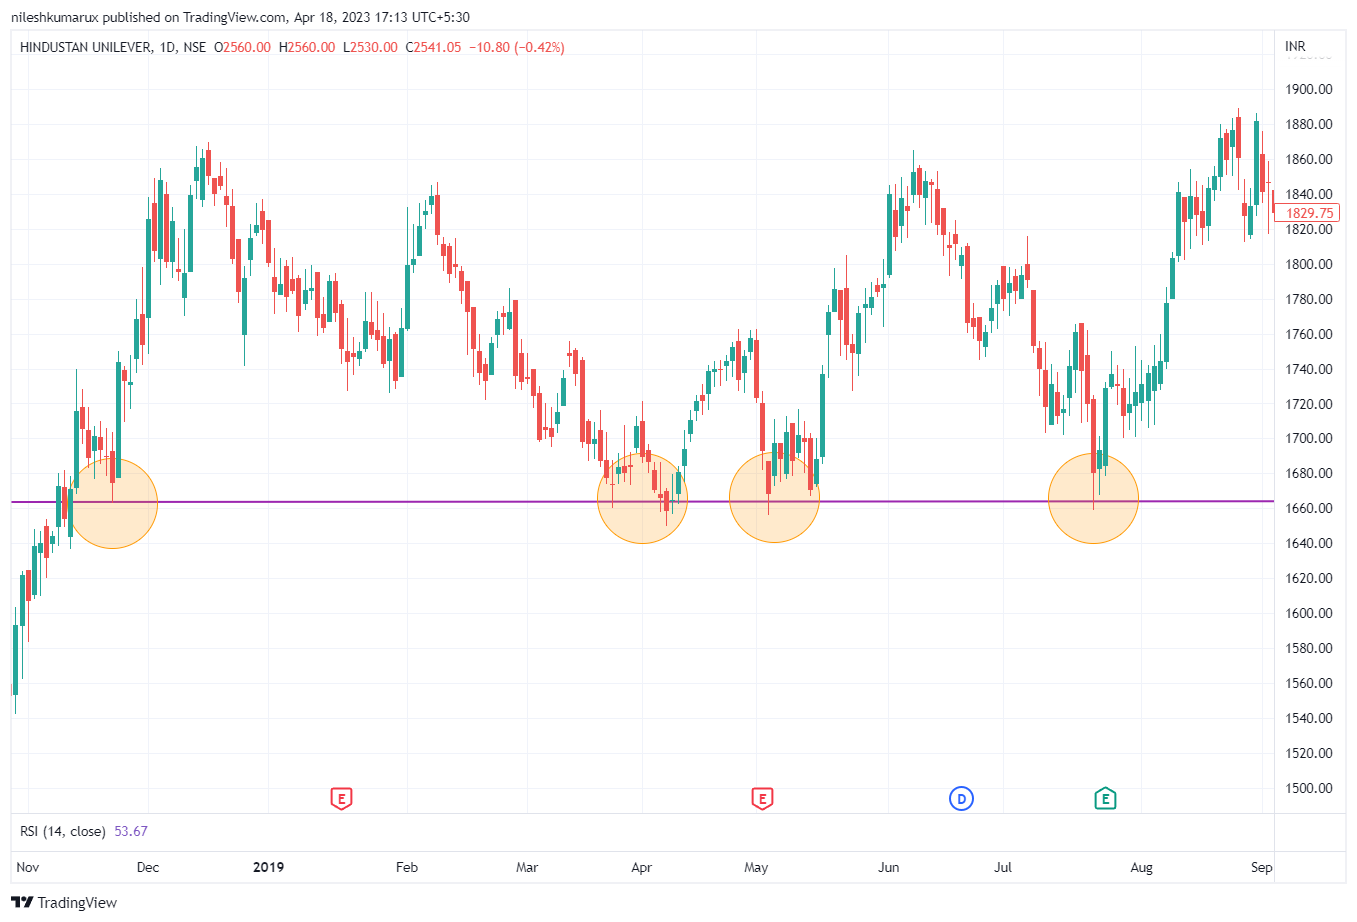
- Horizontal trendlines: These are drawn by connecting the highs or lows that are at the same price level. A horizontal trendline can be used to identify key support or resistance levels, which can be important areas for traders to watch for potential trading opportunities.
- Trend channels: These are drawn by connecting both the upward and downward trendlines in a trend. Trend channels can help traders identify potential buying or selling opportunities when the price approaches either the upper or lower boundary of the channel.
Trendline trading strategy examples
Let’s see some charts for these patterns.
Upward trendlines
To draw an upward trendline, you would start by identifying two or more significant lows in the price chart and drawing a line that connects them.
Downward trendlines
You can draw a downward trendline, you would start by identifying two or more significant high points in the price chart and drawing a line that connects them.
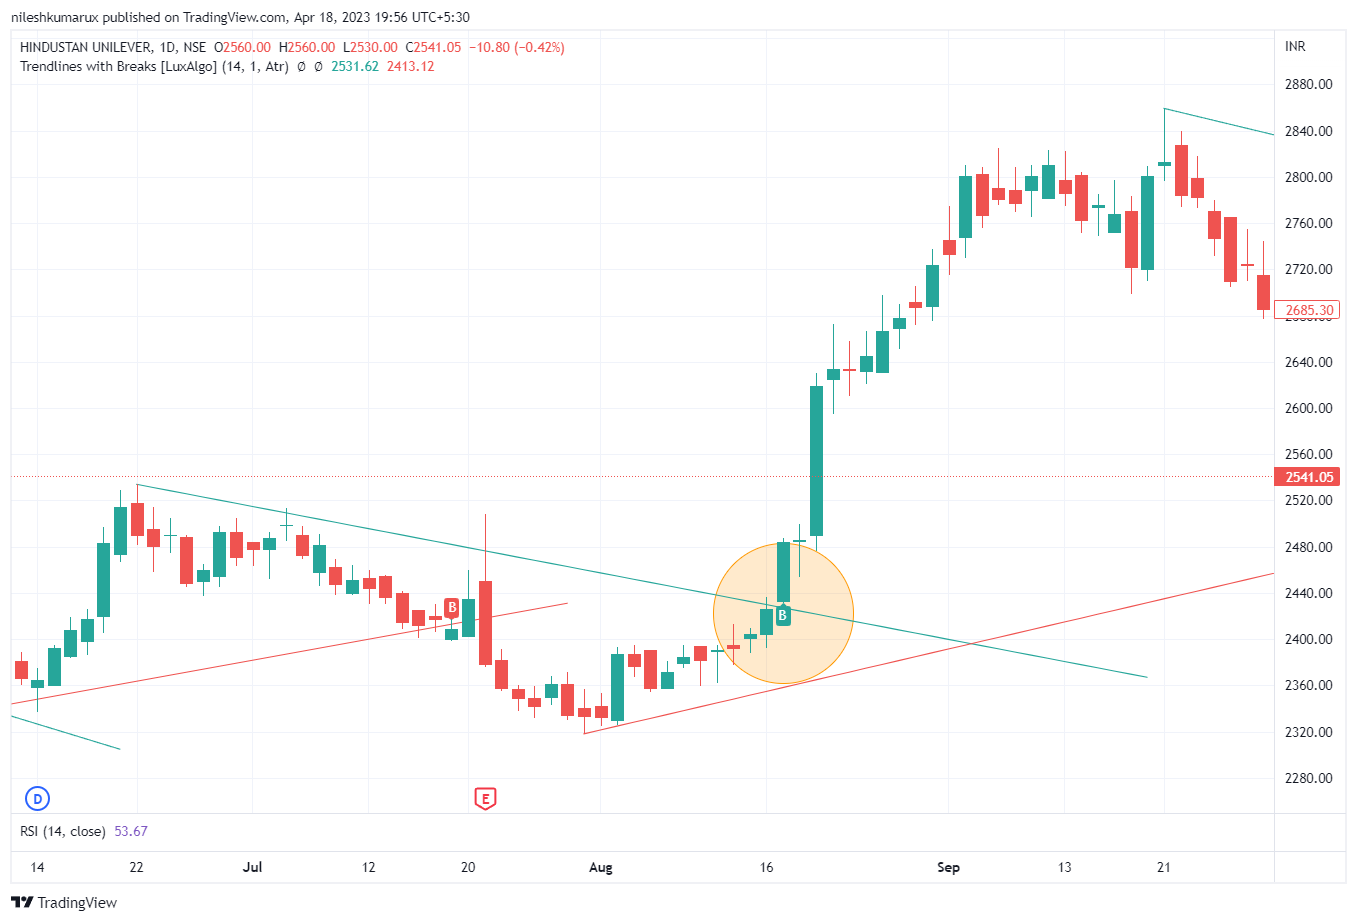
Horizontal trendlines
A horizontal trendline, also known as a support or resistance line, is a line drawn on a price chart that connects two or more horizontal points at the same price level. A horizontal trendline indicates a level at which the price has previously consolidated, indicating a potential area of support or resistance.
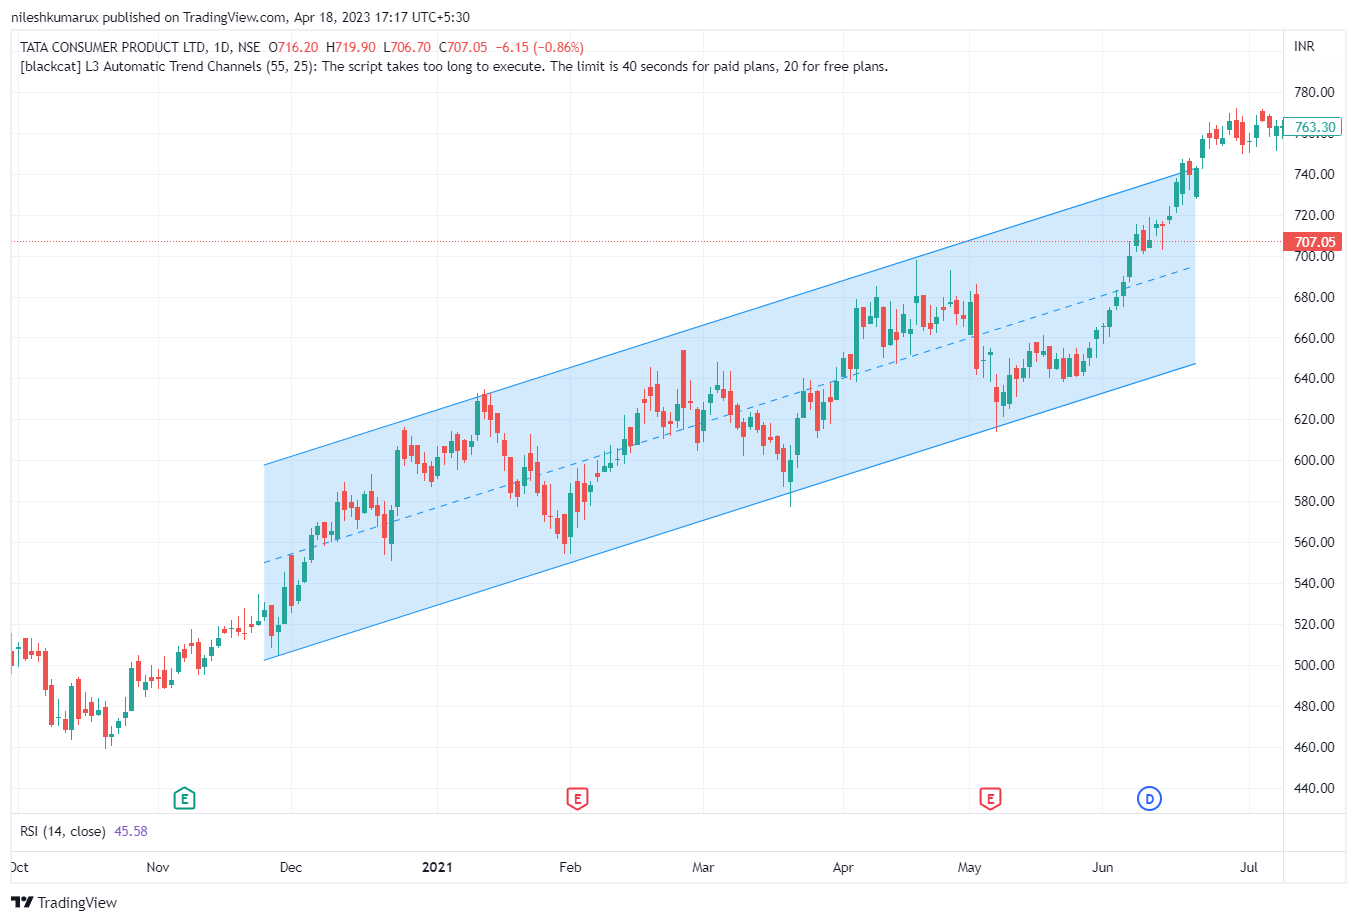
Trend channels
A trend channel consists of two parallel lines drawn on a price chart, with the upper line connecting the highs of the trend and the lower line connecting the lows of the trend. The area between the two lines is known as the channel.
How to Draw a Trend Line correctly
Drawing a trendline correctly is important for accurately identifying trends in the market and making informed trading decisions.
- Identify the trend: Before drawing a trendline, analyze the price chart to identify the overall trend in the market. Look for patterns of higher highs and higher lows for an uptrend or lower highs and lower lows for a downtrend.
- Choose the appropriate points: Once the trend is identified, select two or more significant points on the chart that define the trend. Connect the lowest points or lows for an upward trendline and the highest points or highs for a downward trendline.
- Draw the line: Use a straight edge or drawing tool to connect the chosen points with a line. Ensure the line is as straight as possible without any jagged or wavy sections.
- Validate the trendline: Check to see if the trendline touches or intersects with other significant price levels, such as key support or resistance levels. This helps to confirm the trendline’s accuracy.
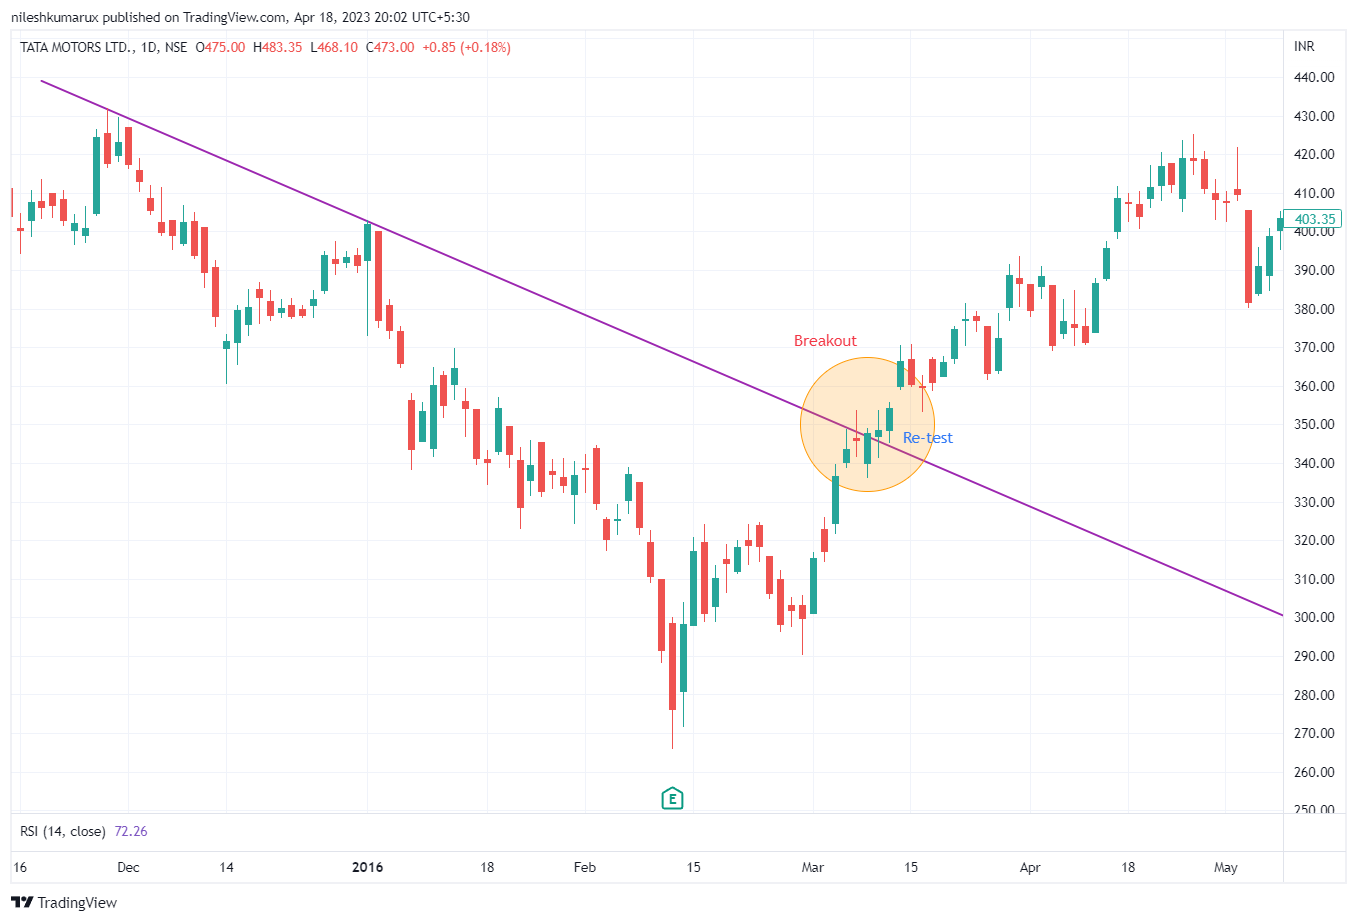
The Trend Line Breakout Strategy
A trend line breakout occurs when the price breaks above or below a trend line, indicating a potential reversal or continuation of the trend.
- Look for a pullback in an uptrend
- Draw a trendline connecting the highs of the pullback
- Wait for the price to break above the trendline before entering the trade.
The simple Trend Line technique identifies significant trends
- Draw an upward trendline.
- Use the trendline as a guide to trail your stop loss order.
- Close the trade if the price closes below the trendline.
Trend Line and trend reversal
A trend reversal occurs when the direction of the trend changes, from an uptrend to a downtrend or vice versa.
- Wait for the price to break above the trendline.
- Wait for a higher low to form, indicating that the sellers have exhausted themselves.
- If the price breaks the swing high, it suggests that the buyers are in control and the market is likely to reverse higher.
It’s important to note that trend reversals can be difficult to predict, and false signals can occur.
Disclaimer: All comapny chart are used only for learing purpose. There is no buy and sell recommandtion. All Technical analyst are learing purpose only.