
What is a candlestick?
A Candlestick is used in technical analysis that shows the low, high, open, and closing prices of a stock for a specific period (minute, hour, week, month, etc). It’s called a Japanese Candlestick and it was developed in the 18th century by Munehisa Homma, a Japanese rice trader
Japanese Candlestick charting and analysis is one of the most effective technical methodologies in the universe of technical analysis.
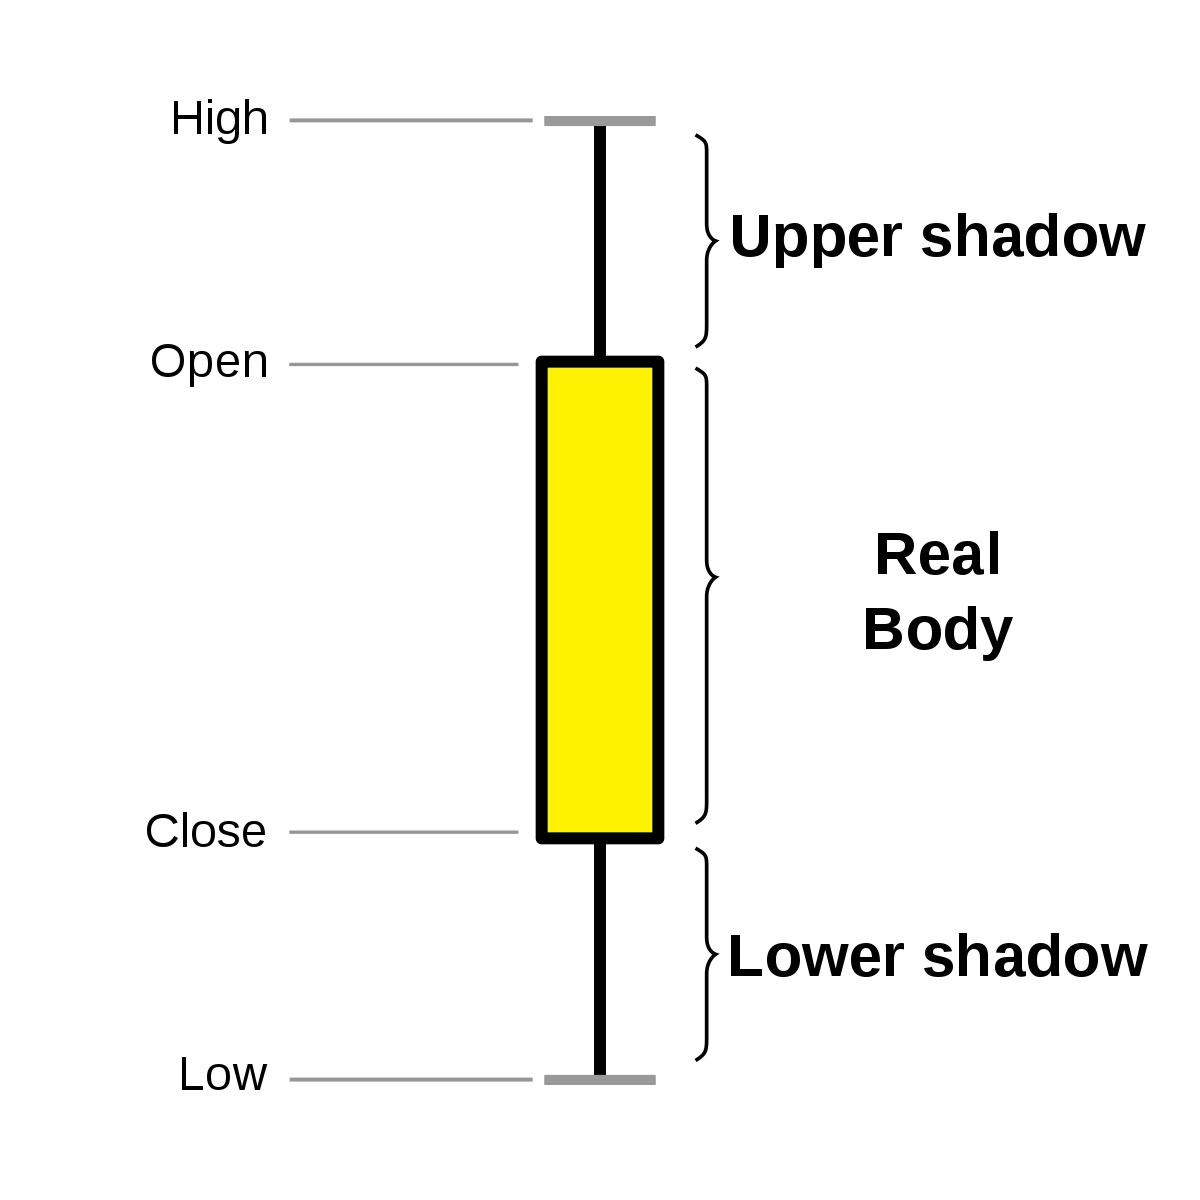
Candlestick chart scheme
Here is forming the Candlesticks.
- High: Highest price for the day.
- Low: Lowest price for the day.
- Open: Opening price
- Close: Closing price
- Body: Body color will depend on open and closing of stock. Black or red body if the stock closed lower than the open price. The body is white or Green if it closes higher than the opening price of the stock.
- Upper shadow/wick: The top part of the upper shadow represents the highest value in the data set of a trading session
- Lower shadow/wick: The bottom of the lower shadow represents the lowest value in the data set.
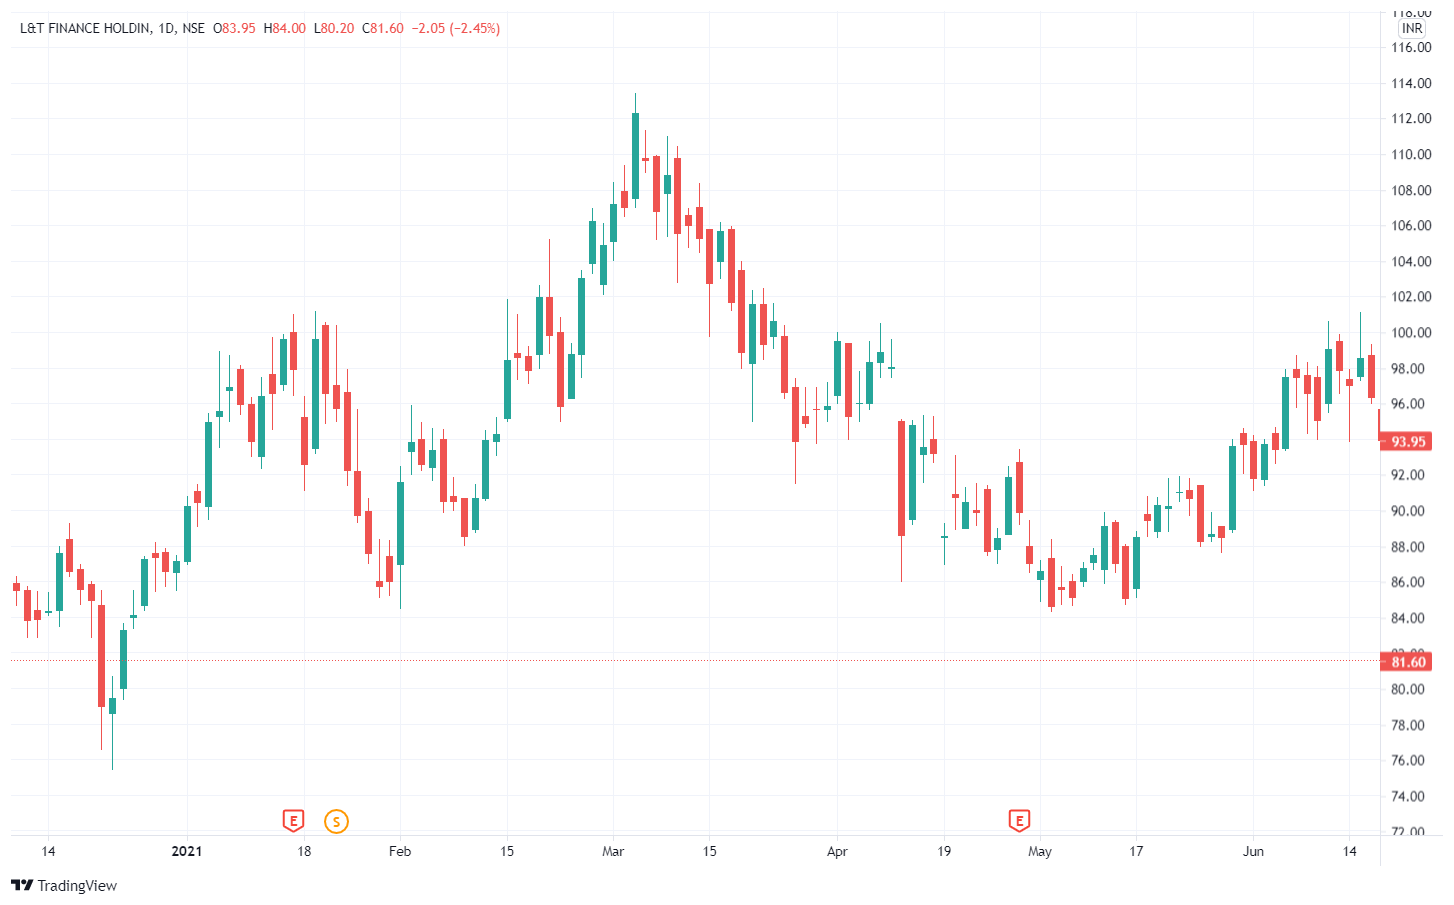
Candlestick Charts
Candlestick Charts provide a great amount of information to the technical analyst. It represents the price movement of a stock over a certain time period.
Once you have become accustomed to the Candlestick charts, the visual aspects of the Candlestick charts will make all other charting techniques seem obsolete.
See below the daily chart.
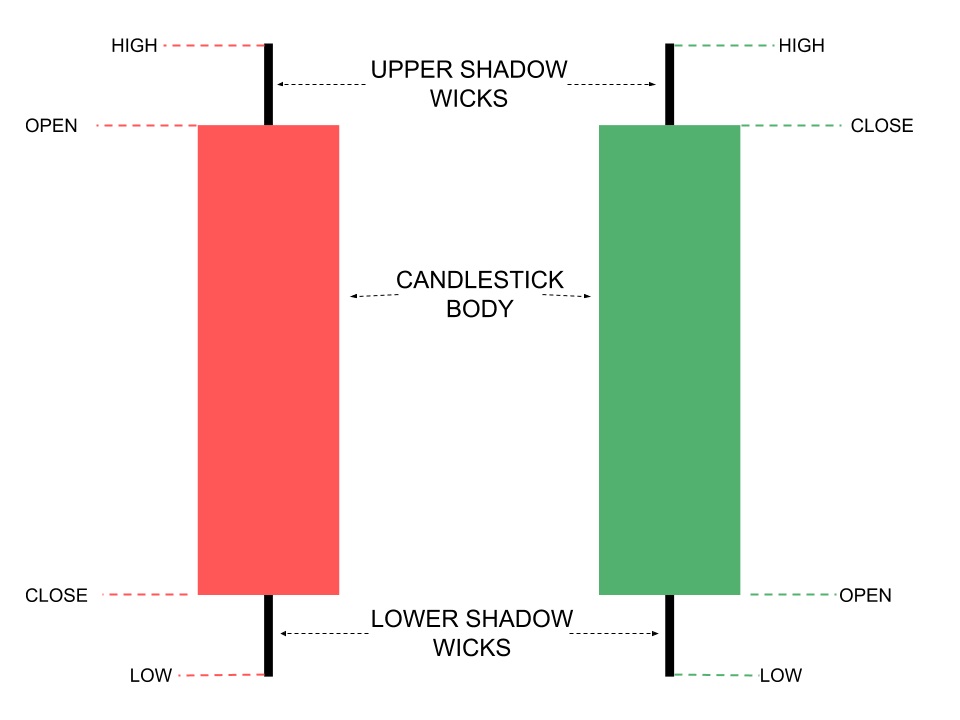
Types of Candlestick
There are many types of candlesticks but first, know Green (white) and Red (black) Candlestick.
- Green (white) Positive: A candlestick is formed if the close is above the open.
- Red (black) Negative candle: candlestick is formed if the close is below the open
Other Types of candlesticks
16 candlestick patterns every trader should know
- Bullish candlestick patterns
- Hammer
- Inverse hammer
- Bullish engulfing
- Piercing line
- Morning star
- Three white soldiers
- Bearish candlestick patterns
- Continuation candlestick patterns
- Doji
- Spinning top
- Falling three methods
- Rising three methods
Disclaimer: All comapny chart are used only for learing purpose. There is no buy and sell recommandtion. All Technical analyst are learing purpose only.