
The kicker candlestick pattern is a two-candlestick pattern that occurs when there is a sharp and sudden reversal in the direction of a trend.
The first candle opens and moves in the direction of the current trend. The second candle opens at the same open as the previous day, a gap open, and heads in the opposite direction of the previous day’s candle
There are 2 types of Kicker Patterns:-
- Bullish Kicker Pattern
- Bearish Kicker Pattern
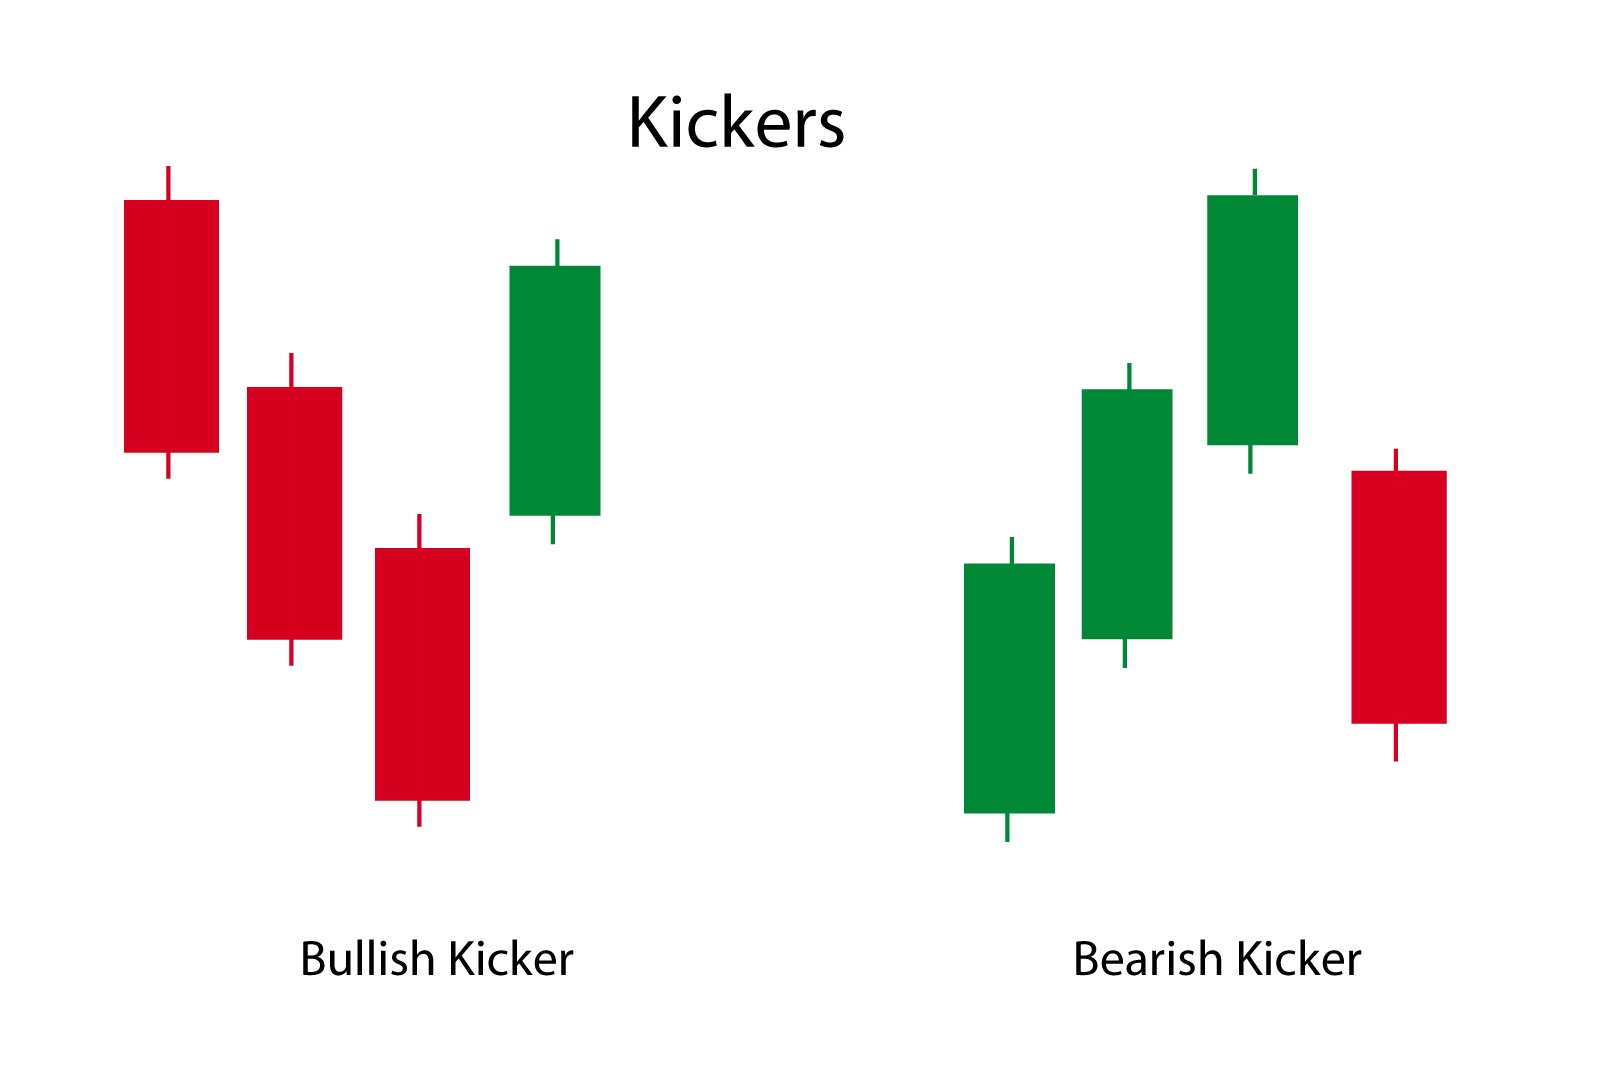
Note: This pattern has a very rare occurrence.
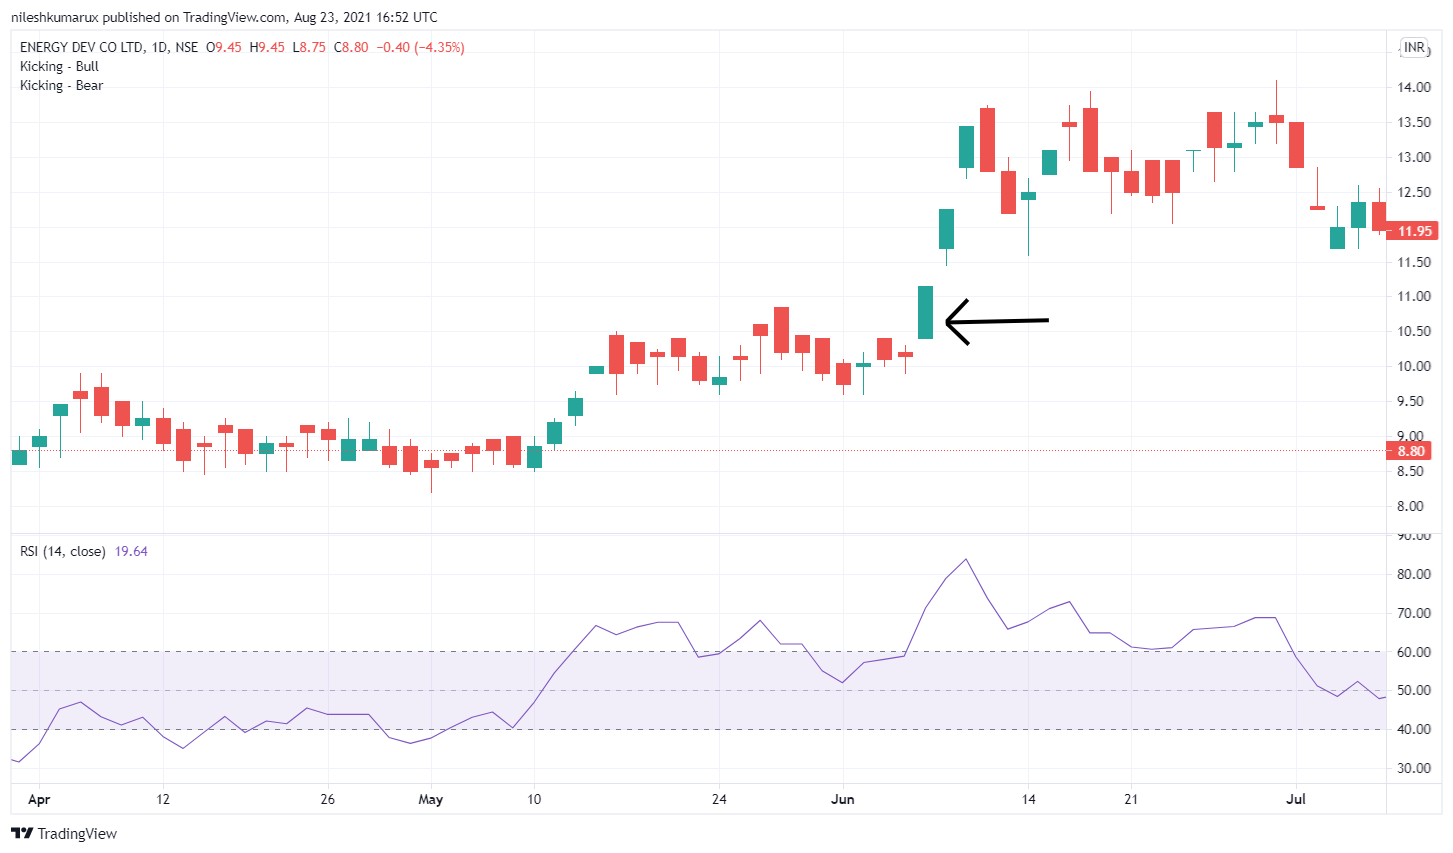
Real Kicker Candlestick Pattern Charts
A bullish kicker pattern indicates that the stock prices could be on the rise. This pattern occurs in a downtrend when a long red candlestick is followed by a long green candlestick that opens above the previous candle’s high.
The green candlestick’s open price marks the beginning of a new uptrend, with strong buying pressure pushing prices higher.

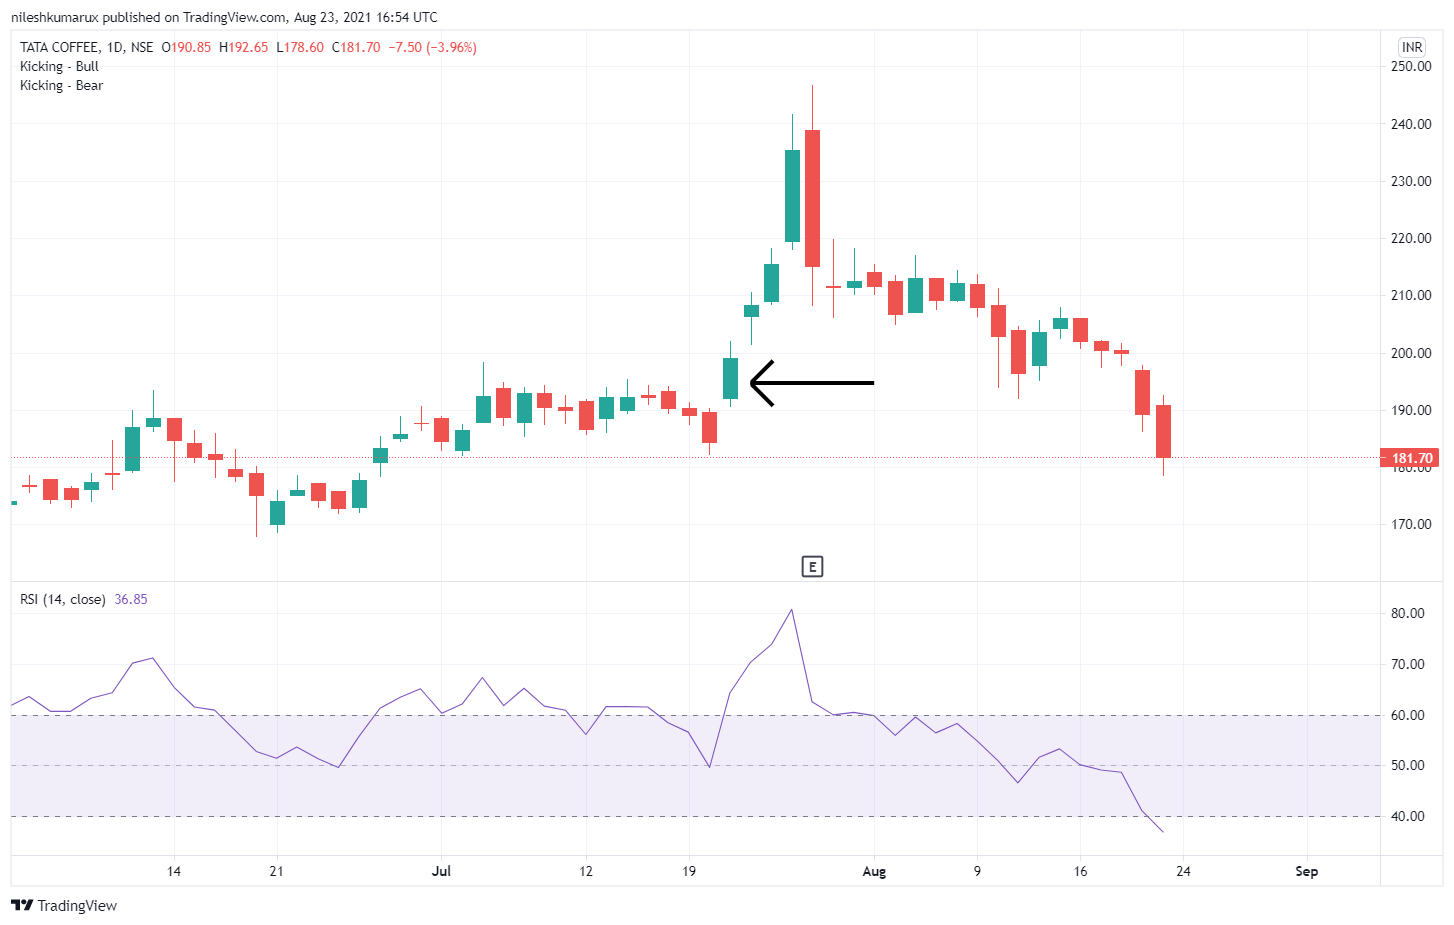
Real Kicker Bearish Charts
Opposite from a bullish kicker pattern, a bearish kicker pattern indicates that the stock prices could be on the reverse.
This pattern occurs in an uptrend when a long green candlestick is followed by a long red candlestick that opens below the previous candle’s low.
The red candlestick’s open price marks the beginning of a new downtrend, with strong selling pressure pushing prices lower.


Both patterns represent a sudden shift in market sentiment, with the second candlestick completely reversing the previous candle’s direction.
This pattern is considered to be a robust and dependable trend reversal pattern that signals a shift in market sentiment. This provides opportunities to traders either enter or exit trades.
Disclaimer: All comapny chart are used only for learing purpose. There is no buy and sell recommandtion. All Technical analyst are learing purpose only.