
The Tri-Star Candlestick Pattern consists of three consecutive Doji candles. The pattern is relatively rare to find and a three-day period illustrates indecision over a period of days.
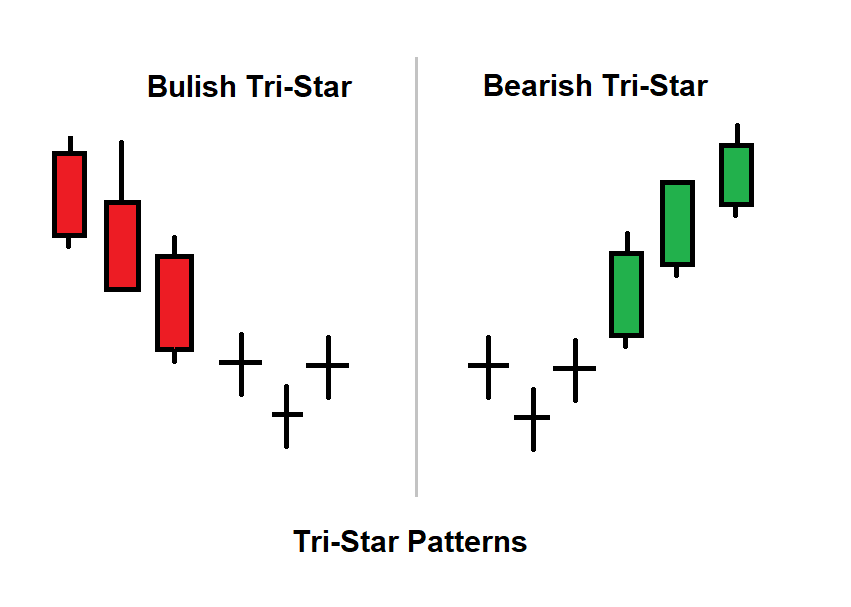
A Doji candle occurs when the opening and closing prices of an asset are virtually the same, resulting in a very small or non-existent real body.
Tri-Star Candlestick Pattern example
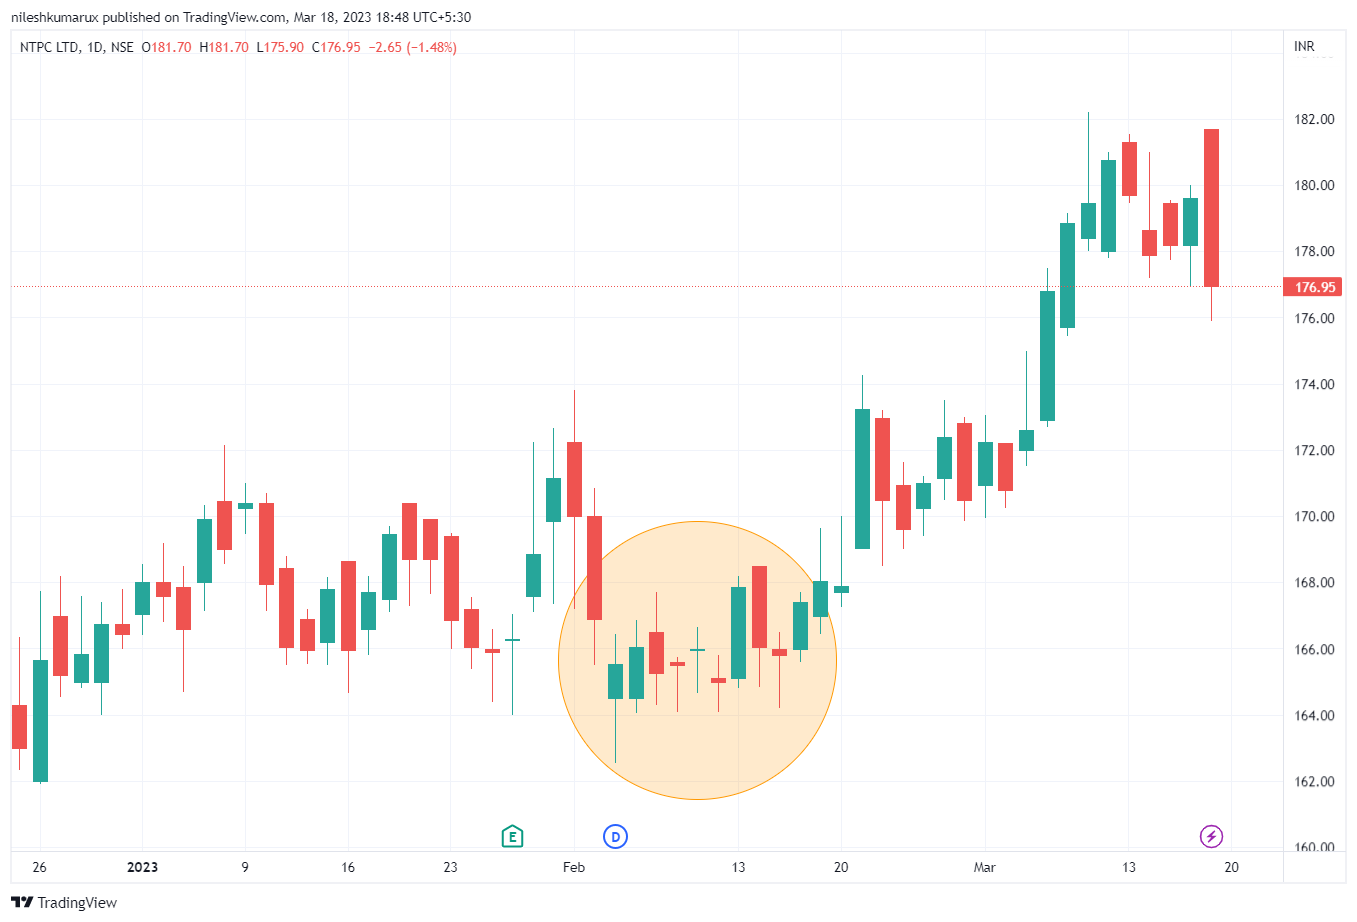
Here are charts with this pattern in the Stock market. Therefore this three-doji pattern is considered a neutral pattern rather than a bullish or bearish pattern.
NTPC
MRF
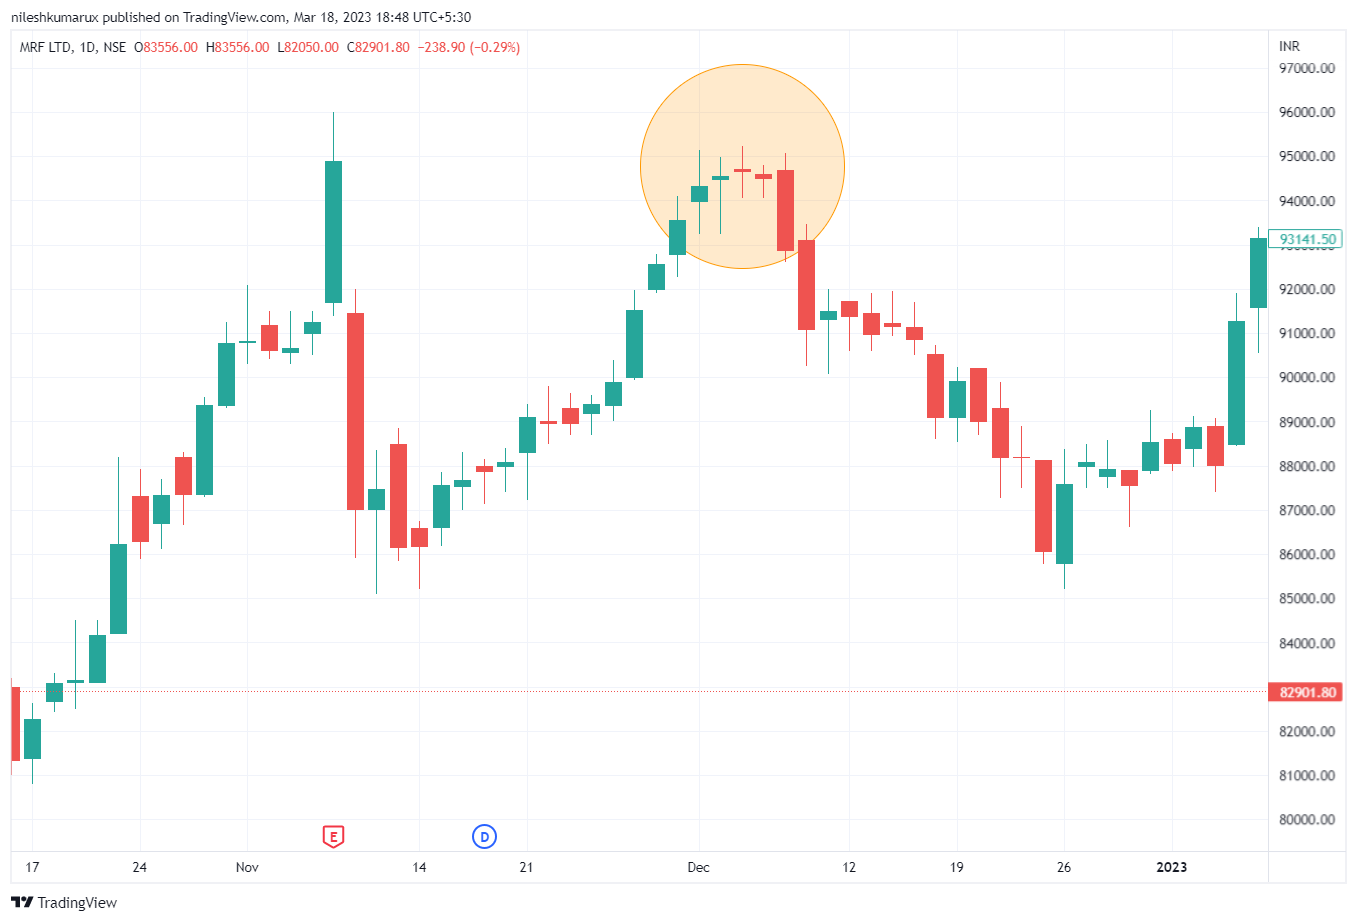
Note: You should wait for confirmation of a breakout in either direction before making a trading decision.
Disclaimer: All comapny chart are used only for learing purpose. There is no buy and sell recommandtion. All Technical analyst are learing purpose only.