
You can draw support and resistance in a trading sock by touching the candlestick in the chart. There are several types of support and resistance, here are some important ones:-
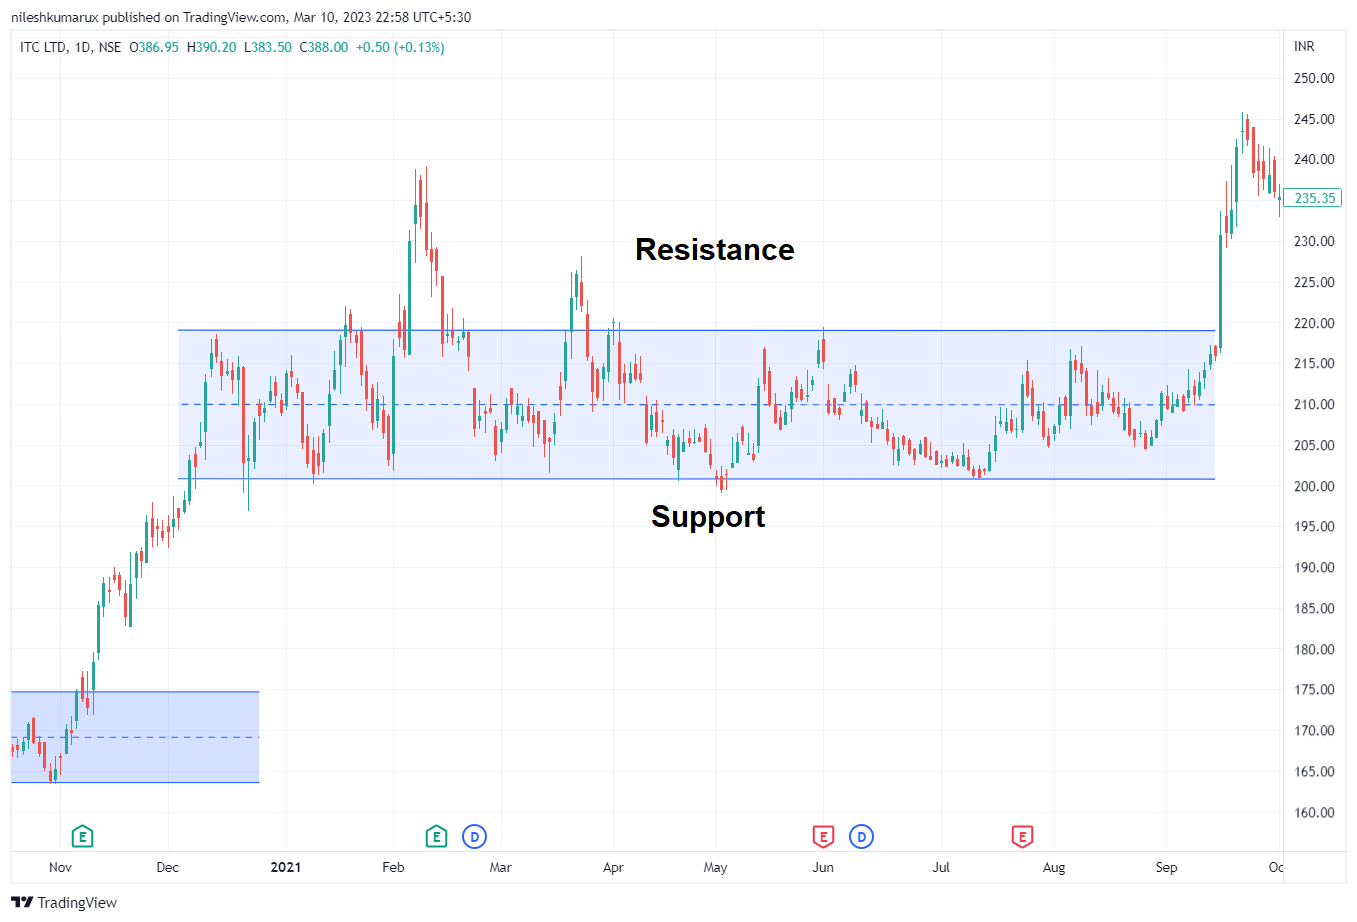
- Horizontal: A horizontal support and resistance level occur at around the same price point. On the side, wave stock is cate flat line on the chart. Traders can buy it when the price reaches the support level and sell when the price reaches the resistance level.
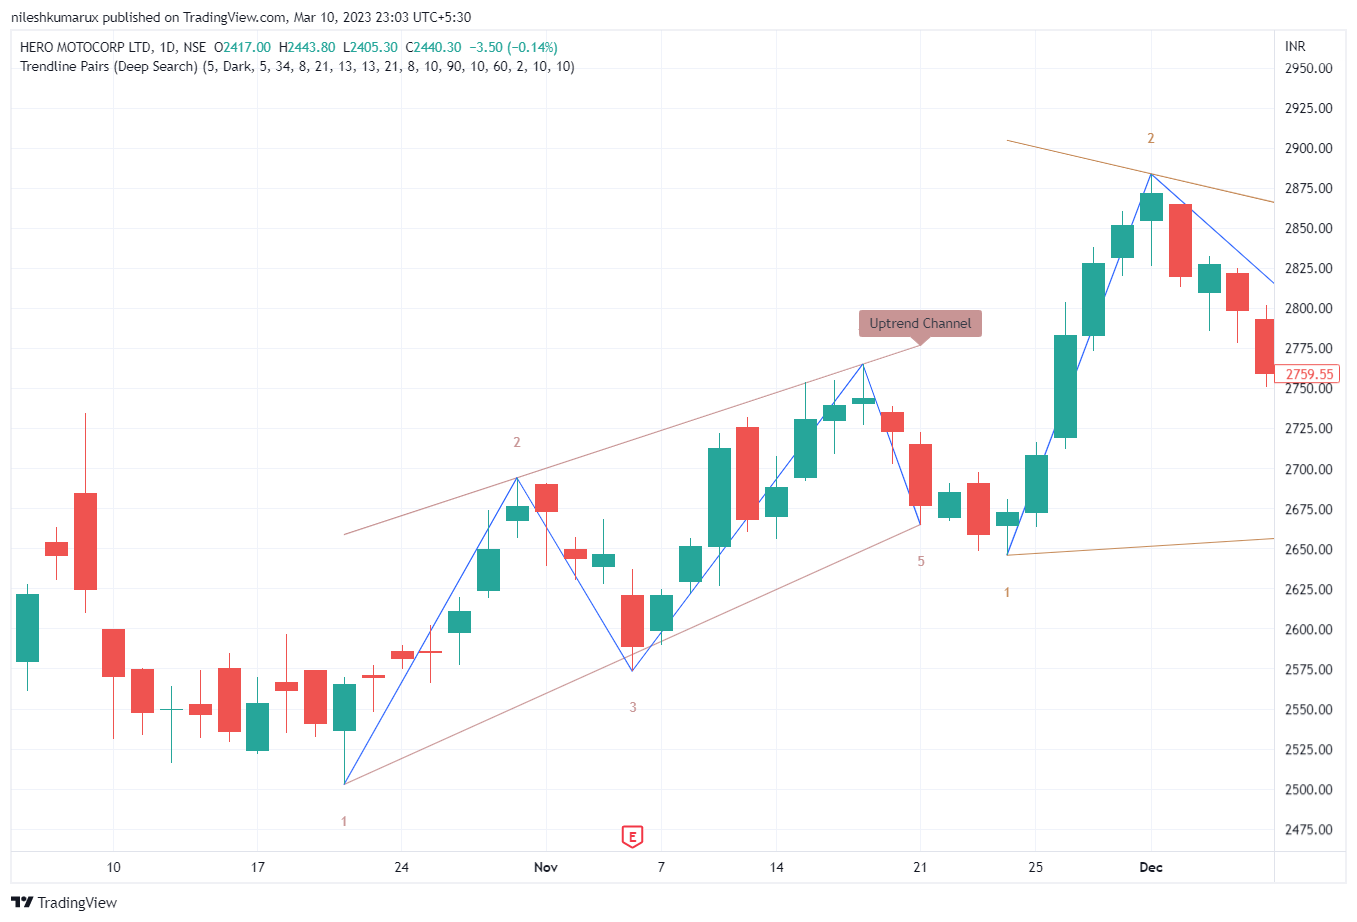
- Trendline: These levels are formed by drawing a line along the trend of the price movement. In an uptrend, the trendline acts as support, and in a downtrend, it acts as resistance. You can buy when the price reaches the trendline support and selling the price reaches the trendline resistance.
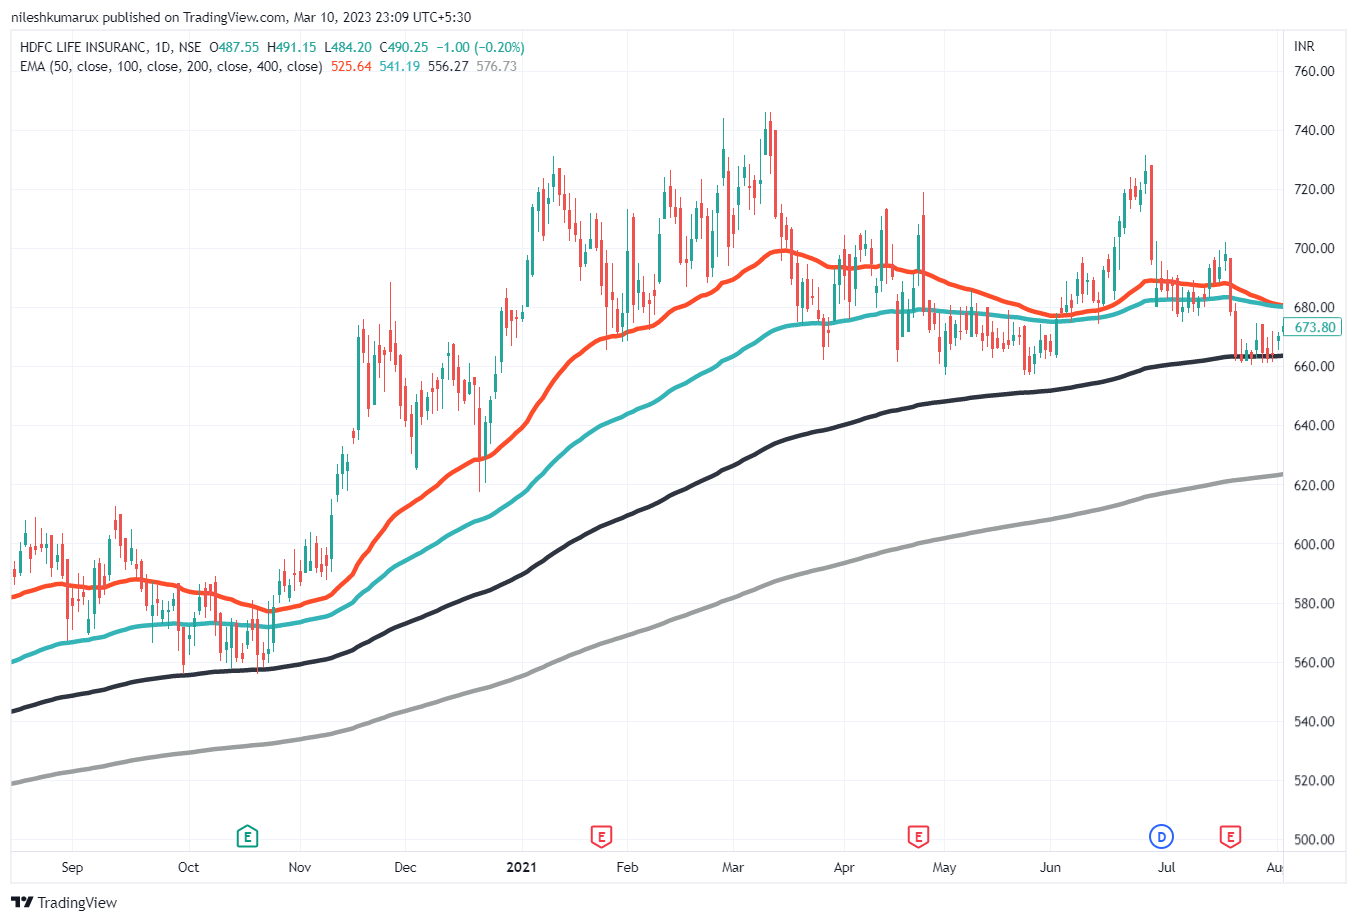
- Moving average: This is technical indicator used to determine the trend direction of securities. The moving average is a calculation to analyze data points by creating a series of averages closing and opening price of stock.
- Psychological support and resistance: Support occurs where a downtrend is expected to pause, due to a concentration of demand. Resistance occurs where an uptrend is expected to pause temporarily, due to a concentration of supply.
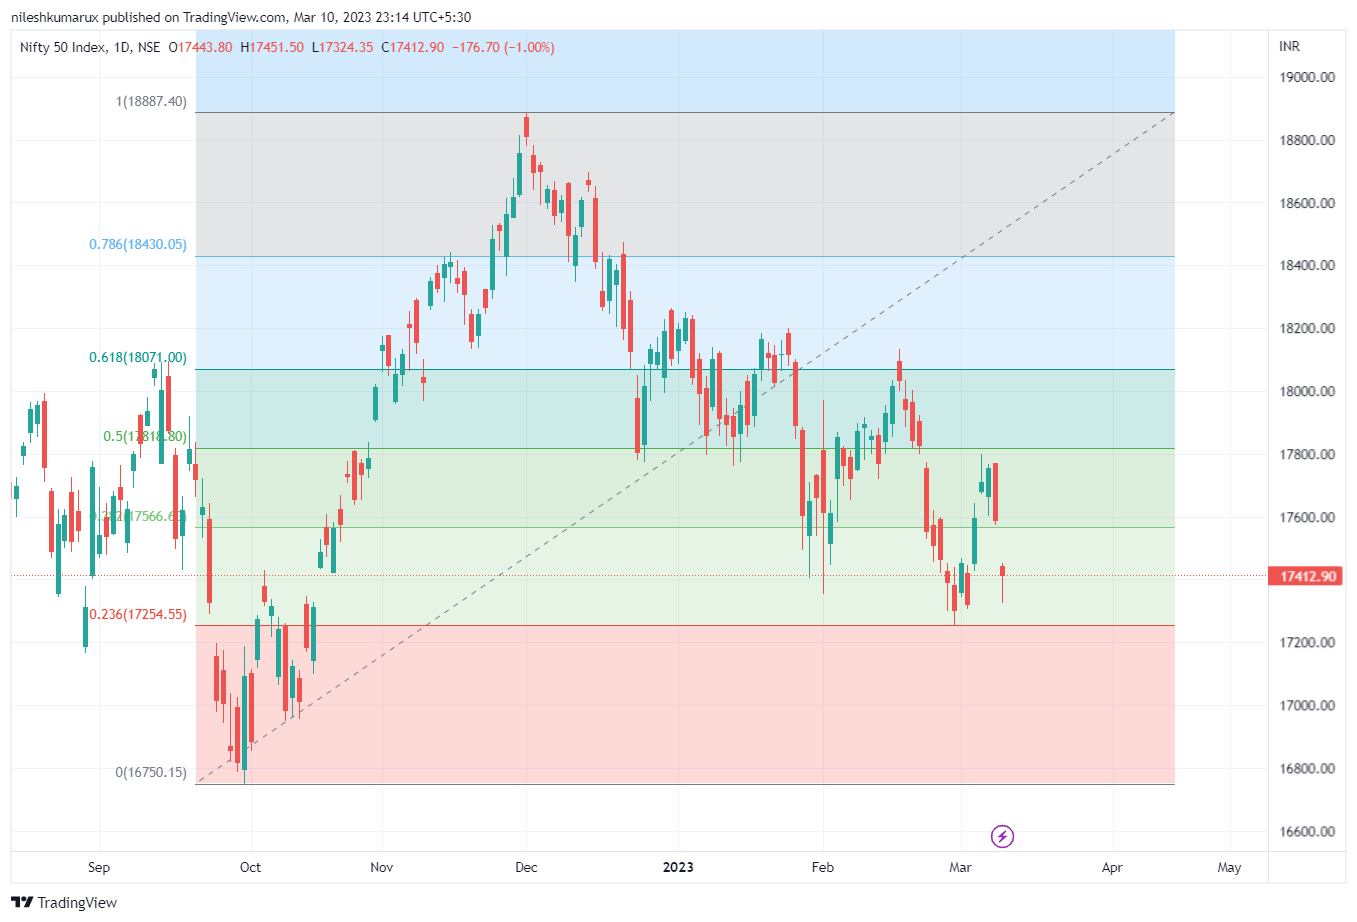
- Fibonacci retracement: levels are lines on a graph at which a stock’s potential buy and sell values, or resistance and support price levels. These levels are best used as a tool within a broader strategy.
Types of support and resistance examples
Hare some basics chart for every type of support and resistance.
Horizontal
Trendline
Moving average
Fibonacci retracement:
Do comment if you have more input reading this topic and use a combination of different types of support and resistance levels to identify potential buying and selling opportunities in the stock market.
Disclaimer: All comapny chart are used only for learing purpose. There is no buy and sell recommandtion. All Technical analyst are learing purpose only.