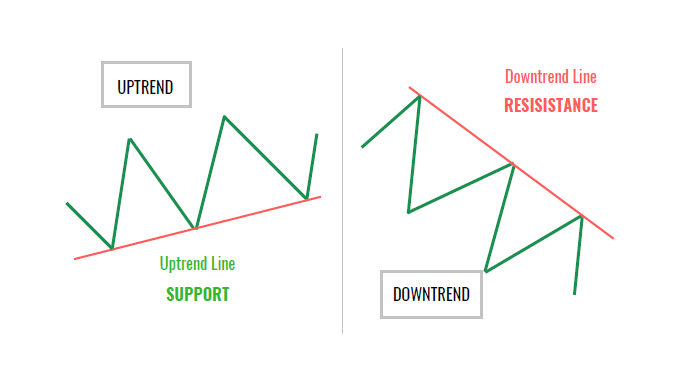
In Technical Analysis Trendline is used to identify trends and make trading decisions based on the direction of the trend. A trendline is a straight line that is drawn on a chart to help visualize the overall direction of a set of candlesticks in stock.

Trendlines are commonly used in finance, economics, and other fields to help identify patterns and trends in data. When a trendline is drawn on a price chart of a stock, it can help traders identify support and resistance levels.
A trendline drawn through a series of higher lows can be considered a support level, while a trendline drawn through a series of lower highs can be considered a resistance level.
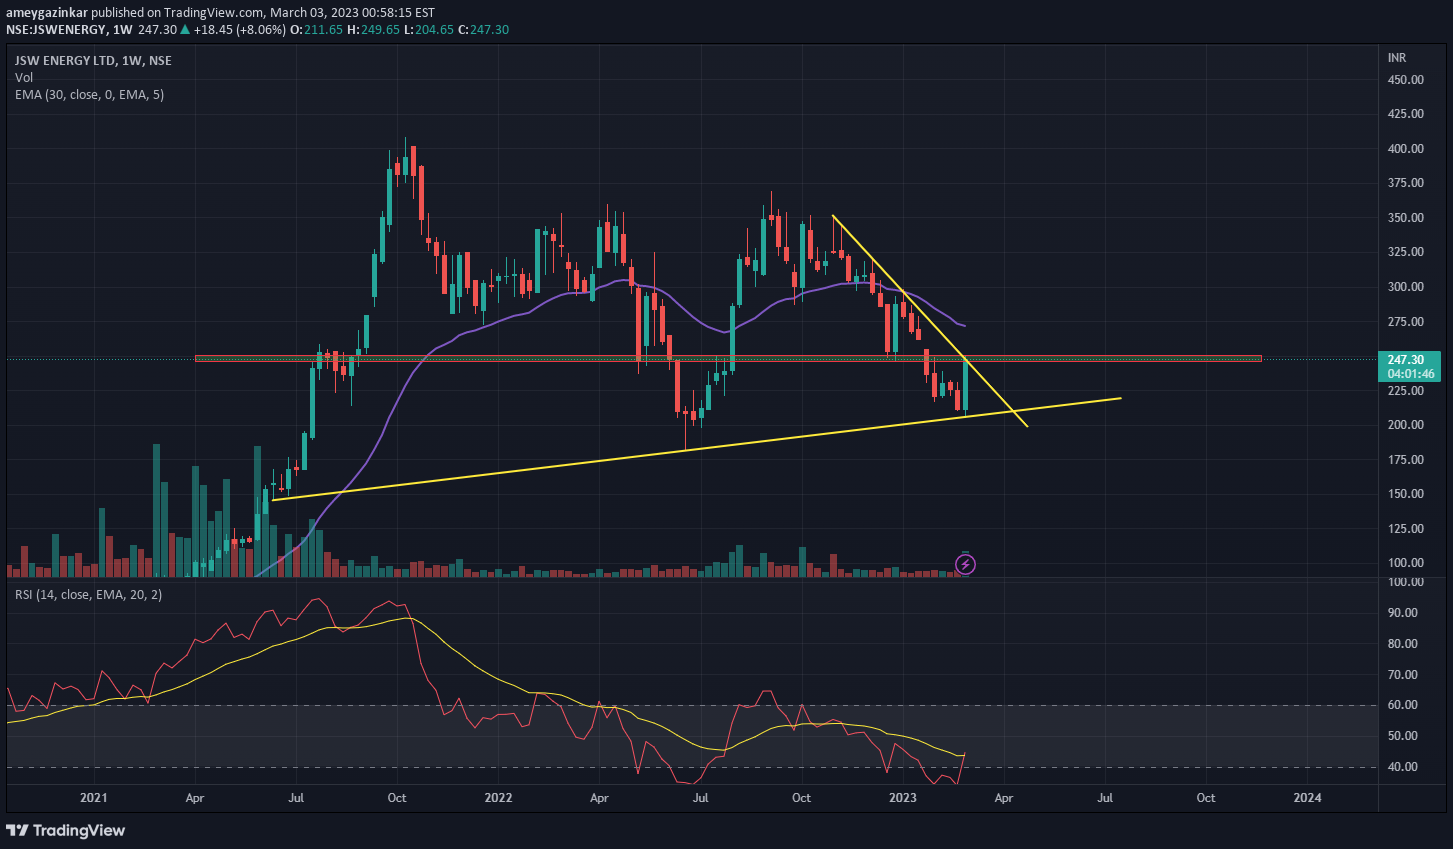
Example Using a Trendline
Here is good support reversal or breakouts in Energy sector stocks from the past couple of weeks.

Does Trendline alone work well?
Answer: Traders will often use trendlines in combination with other technical indicators, such as moving averages or oscillators, to confirm the direction of the trend and to identify potential trading opportunities.
While trend lines can be a useful tool in technical analysis, they should not be relied on solely for making trading decisions. There are several reasons for this:
- Trend lines are subjective: Trend lines are drawn by connecting two or more price points on a chart, and the placement of these points can be subjective. Different traders may draw trend lines differently, which can lead to confusion and inconsistency in trading decisions.
- Trend lines can be broken: Trend lines are not always reliable as support or resistance levels. A break above or below a trend line may not necessarily signal a change in trend direction, and false breakouts can occur. Therefore, it’s important to use other technical indicators and analysis tools to confirm the trend direction and potential entry and exit points.
- Trend lines may not work in all market conditions: Trend lines work best in markets with strong trends, but in markets that are choppy or range-bound, they may not be as effective.
Disclaimer: All comapny chart are used only for learing purpose. There is no buy and sell recommandtion. All Technical analyst are learing purpose only.