
Support and Resistance are used in the stock market to find and analyze the behavior of prices in the chart. It’s a basic concept of the technical analyst in trading.
Support can be a price level on the chart or a price zone and Resistance is the opposite of support. In trading, support refers to a price level where there is expected buying pressure and means that it is unlikely that the price will fall below this level.
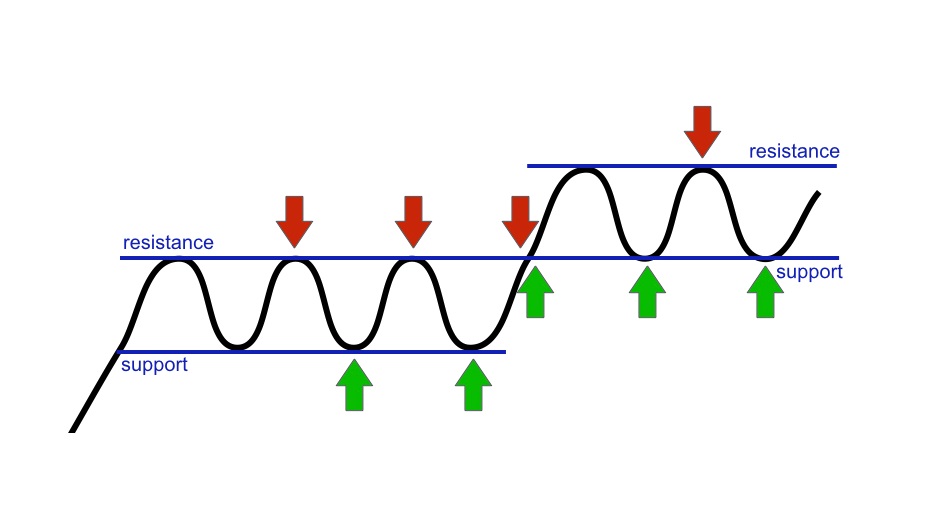
Support and Resistance examples
Here is one chart with basic details on this topic.
Support and resistance levels are key price levels that traders use to make decisions on when to enter or exit any stock or share market. Support levels provide traders with potential buying opportunities, while resistance levels provide potential selling opportunities.
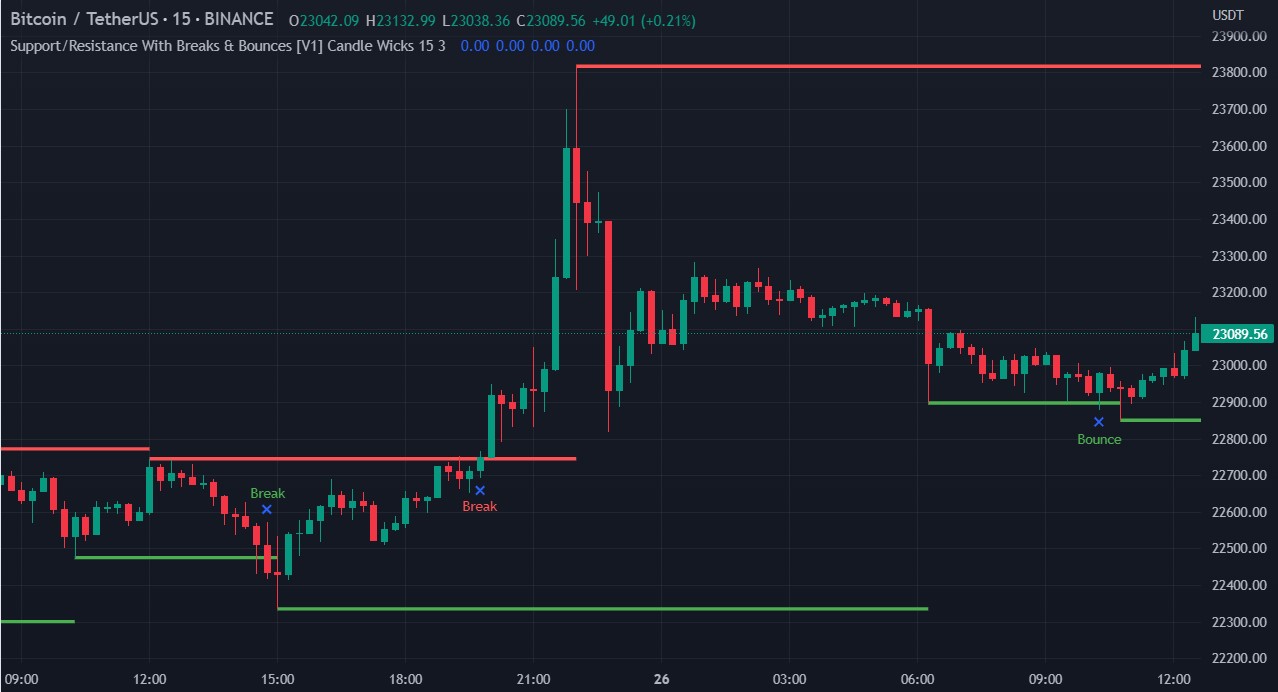
How to draw Support and Resistance
You can Draw a line connecting the lows (for support) or highs (for resistance): For support, identify the lowest points of the trend and draw a straight line connecting those points. For resistance, identify the highest points of the trend and draw a straight line connecting those points.
You should connect more candlesticks points where the price touches or bounces off the support or resistance line. The higher-than-average volume helps confirm the breakout.
Disclaimer: All comapny chart are used only for learing purpose. There is no buy and sell recommandtion. All Technical analyst are learing purpose only.