Morning star candlestick pattern formed after an obvious downtrend. It is consisting of three candlesticks that are interpreted as a bullish sign by technical analysts. Where the first candlestick is bearish, the second candle is small and the third candle is a bullish candlestick.
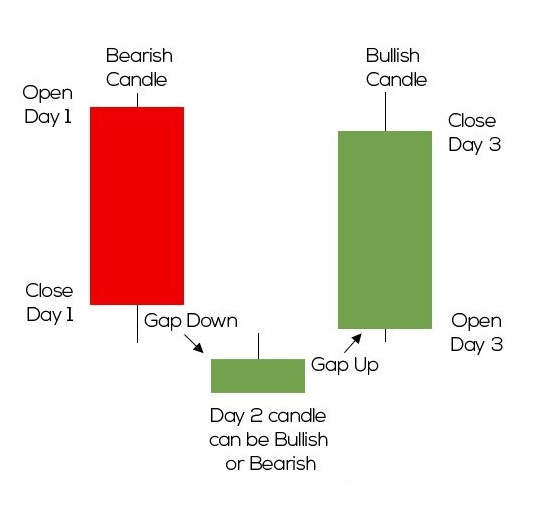
Identify the Morning star pattern
- The stock trend should be a downtrend.
- The body of the first candle is Red, continuing the current trend. The second candle should be small and is an indecision formation.
- That candle should green body and close at least halfway up the red candle.
Strong chances of reversal with the Morning star pattern
- The longer the Red candle and the green candle.
- 3rd candlestick has more indecision than the star day illustrates, the better probability that a reversal will occur.
- A gap down opening the second day adds to the probability that a reversal is occurring.
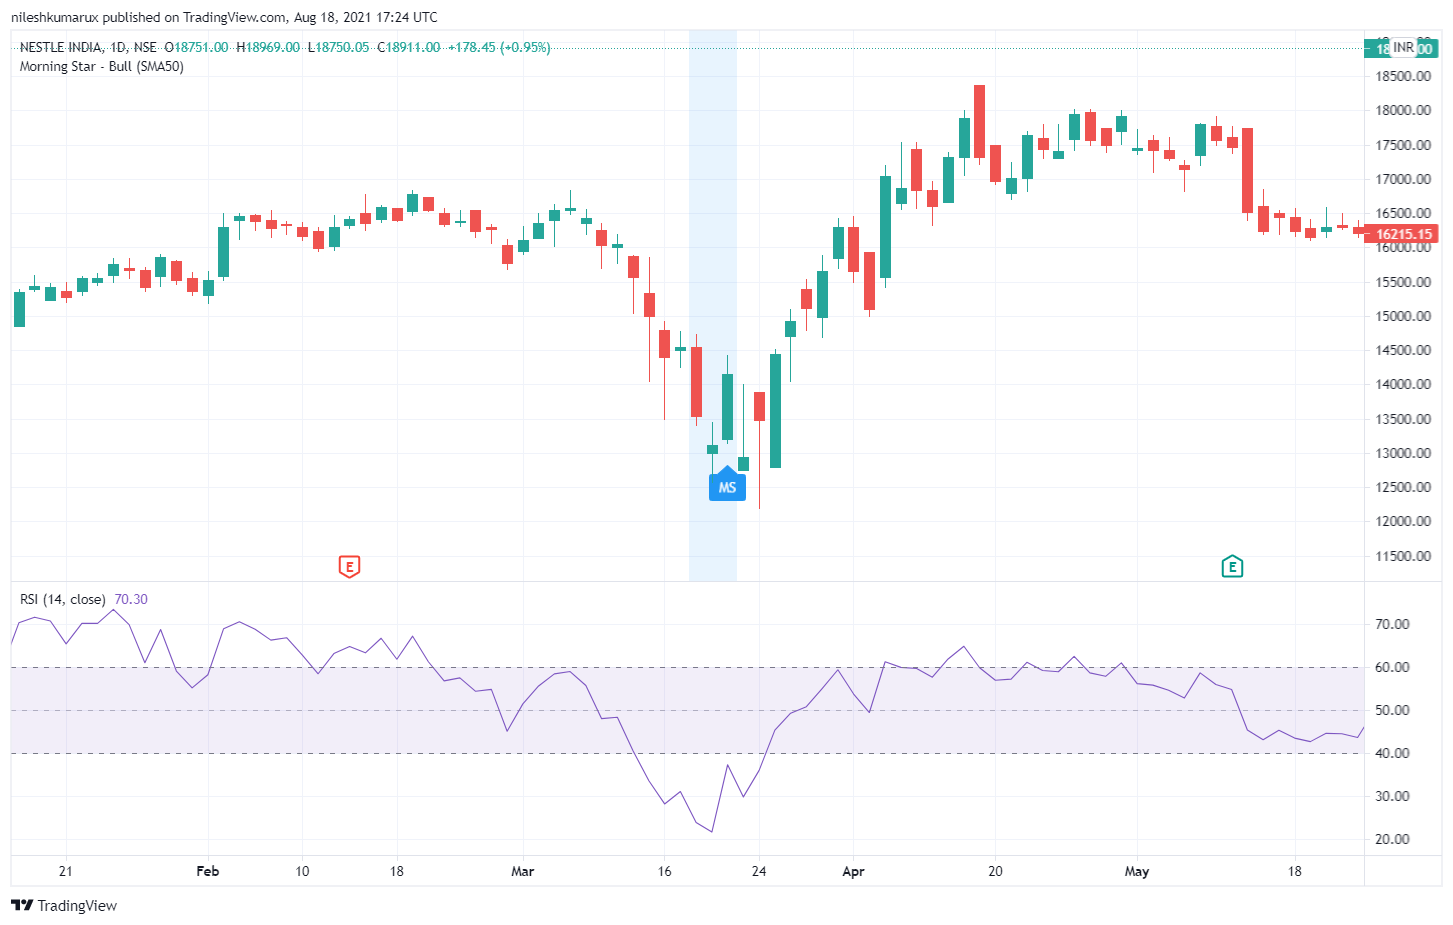
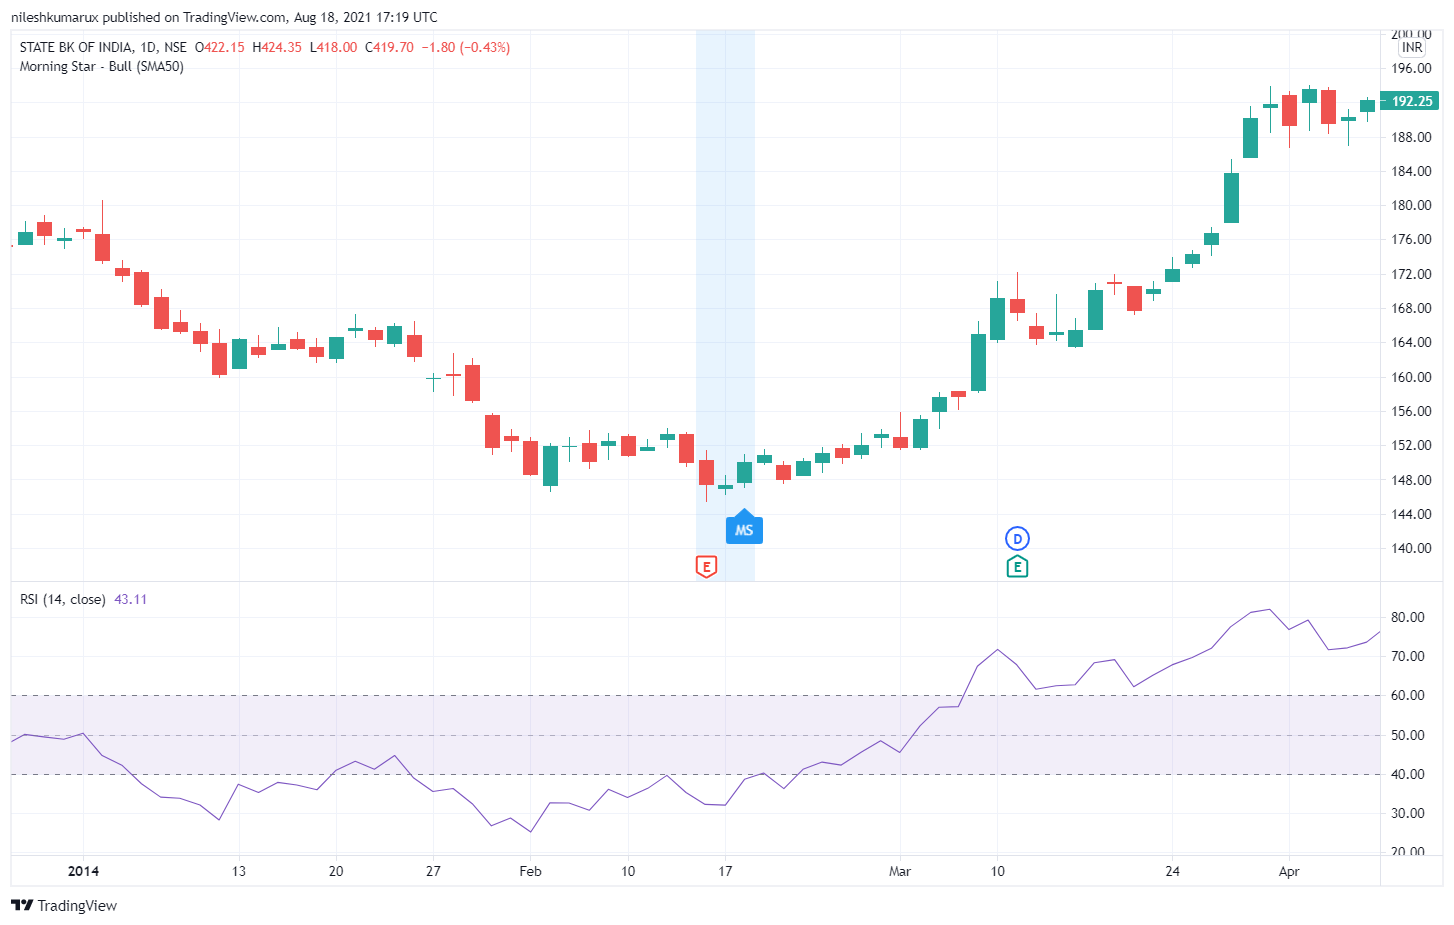
Chart of Morning star candlestick
Click on images to zoom in and see clear charts.
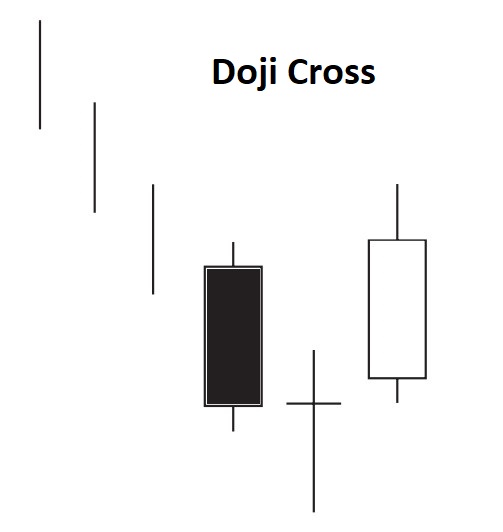
MORNING STAR DERIVATIVES
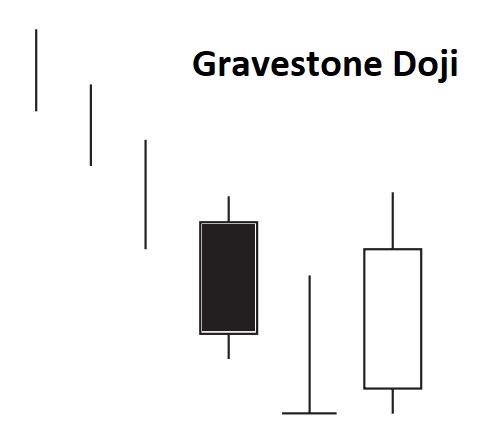
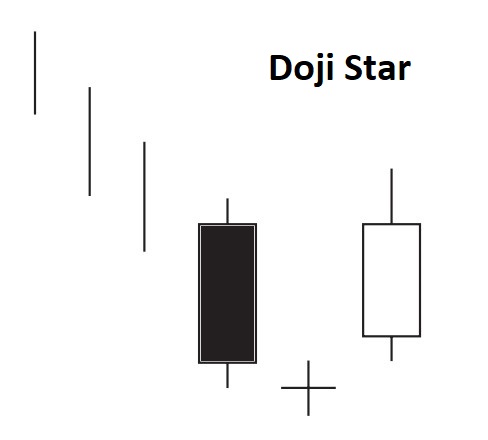
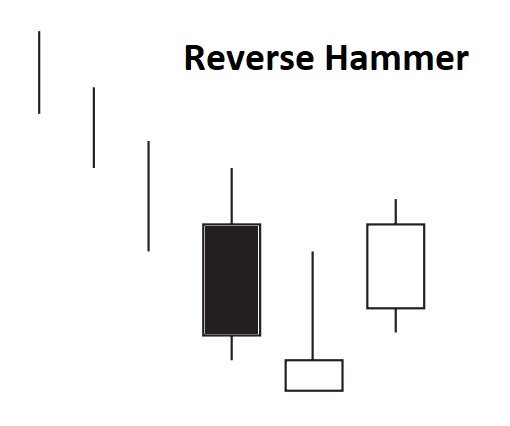
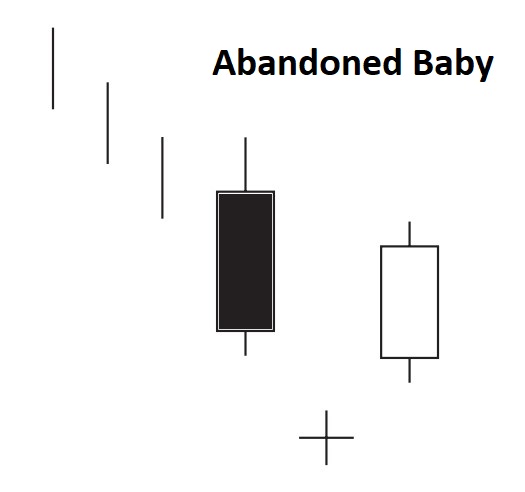
Disclaimer: All comapny chart are used only for learing purpose. There is no buy and sell recommandtion. All Technical analyst are learing purpose only.