
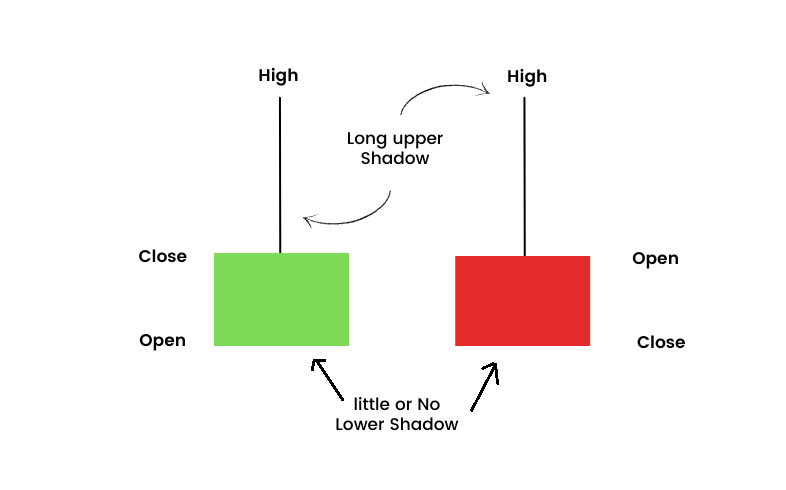
In Technical analysis, an Inverted Hammer candlestick is a bullish reversal Pattern, which forms at the bottom of a downtrend. You can identify it by a long lower shadow and a small body at the top of the candlestick.
You can’t sure about a bullish reversal when you see an Inverted Hammer until the next day’s bullish candlestick pattern or an increase in volume.
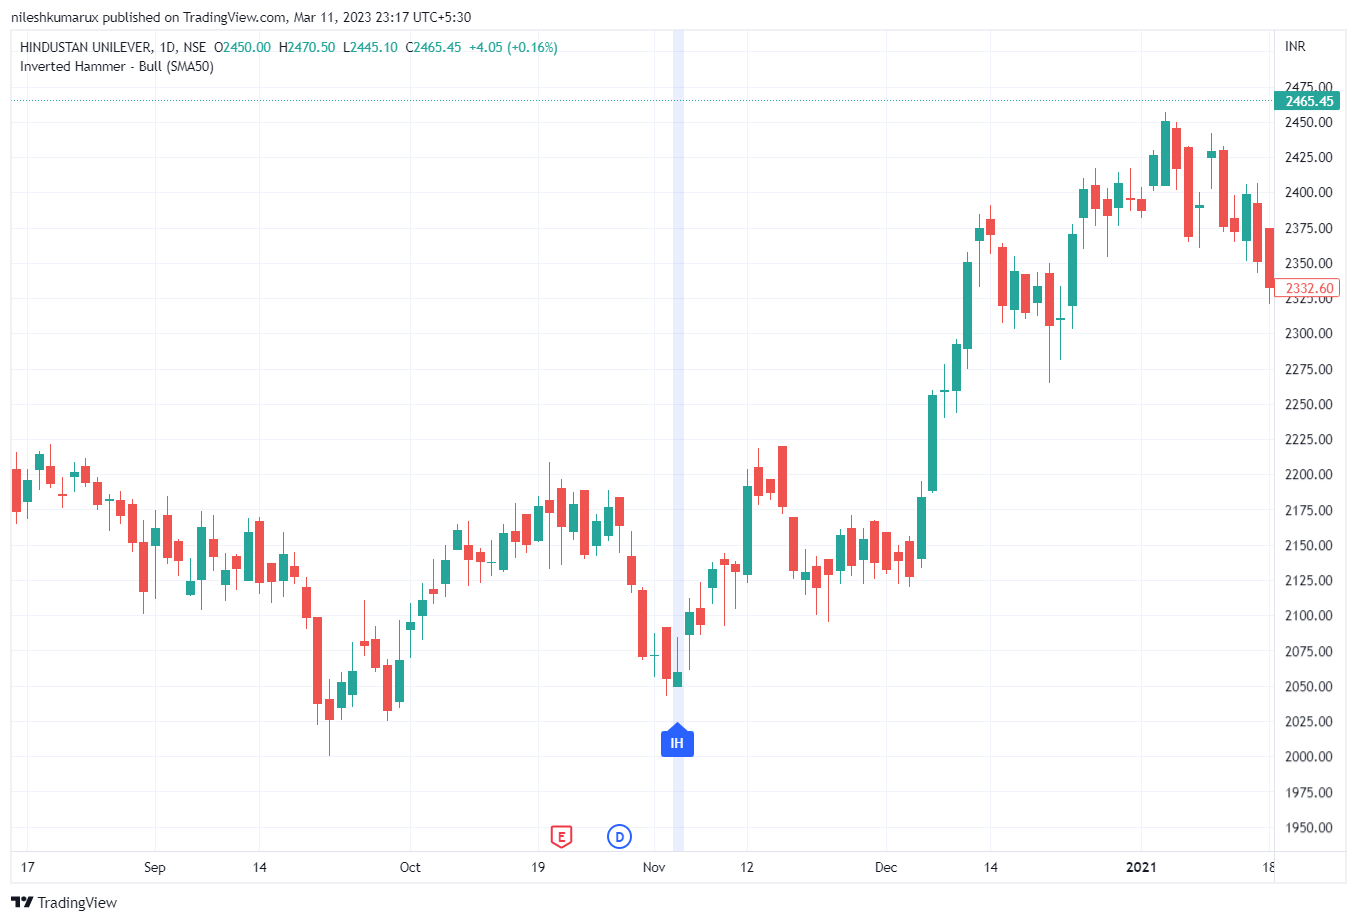
Inverted Hammer candle examples
Here is an example of how this pattern actually shows in the stock chart.
Green vs Red inverted Hammer pattern
The green Inverted Hammer candlestick is considered a stronger bullish compared to the red Inverted Hamme. Green is the opening price of the commodity that is lower than the closing price and Red is the closing price of the commodity that is lower than the opening price.
Note: In most cases, inverted Hammer failed and this is not foolproof. Use other technical indicators and analysis before making any trading decisions.
Do comment if you have to add any new input on this topic.
Disclaimer: All comapny chart are used only for learing purpose. There is no buy and sell recommandtion. All Technical analyst are learing purpose only.