
The Harami Candlestick pattern is composed of a two-candle formation. It’s a Japanese candlestick pattern where the first candle is larger, with a Red or Green body and the second one is small inside a Red or Green candle. This pattern indicates a potential reversal or continuation of the market trend.

Note: The word ‘Harami’ is derived from the Japanese word for ‘pregnant’, which represents the Harami candlestick pattern.
Harami patterns are two types:
- Bullish Harami – the selling has stopped
- Bearish Harami
Let’s understand both types of Harami patterns one by one in detail.
Bullish Harami Pattern
In the Bullish Harami pattern first candle’s body color same as the current trend. And the body should be longer, where the second candle should be smaller and open and the close occurs inside the open and the close of the previous day.
This pattern could indicate that the trend is over.
Identify Bullish Harami candlestick Pattern
- The body of the first candle is Red; the body of the second candle is Green.
- A long black candle occurs at the end of the trend.
- The second-day candle is smaller and opens higher than the close of the previous day and closes lower than the opening of the prior day.
- The Inside candle requires both the body and the shadows to remain inside the previous day’s body.
Strong chance of Bullish Harami Pattern works
- Confirmation is required to indicate that the trend is now moving up.
- The longer the Red candle and the Green candle, the more forceful the reversal.
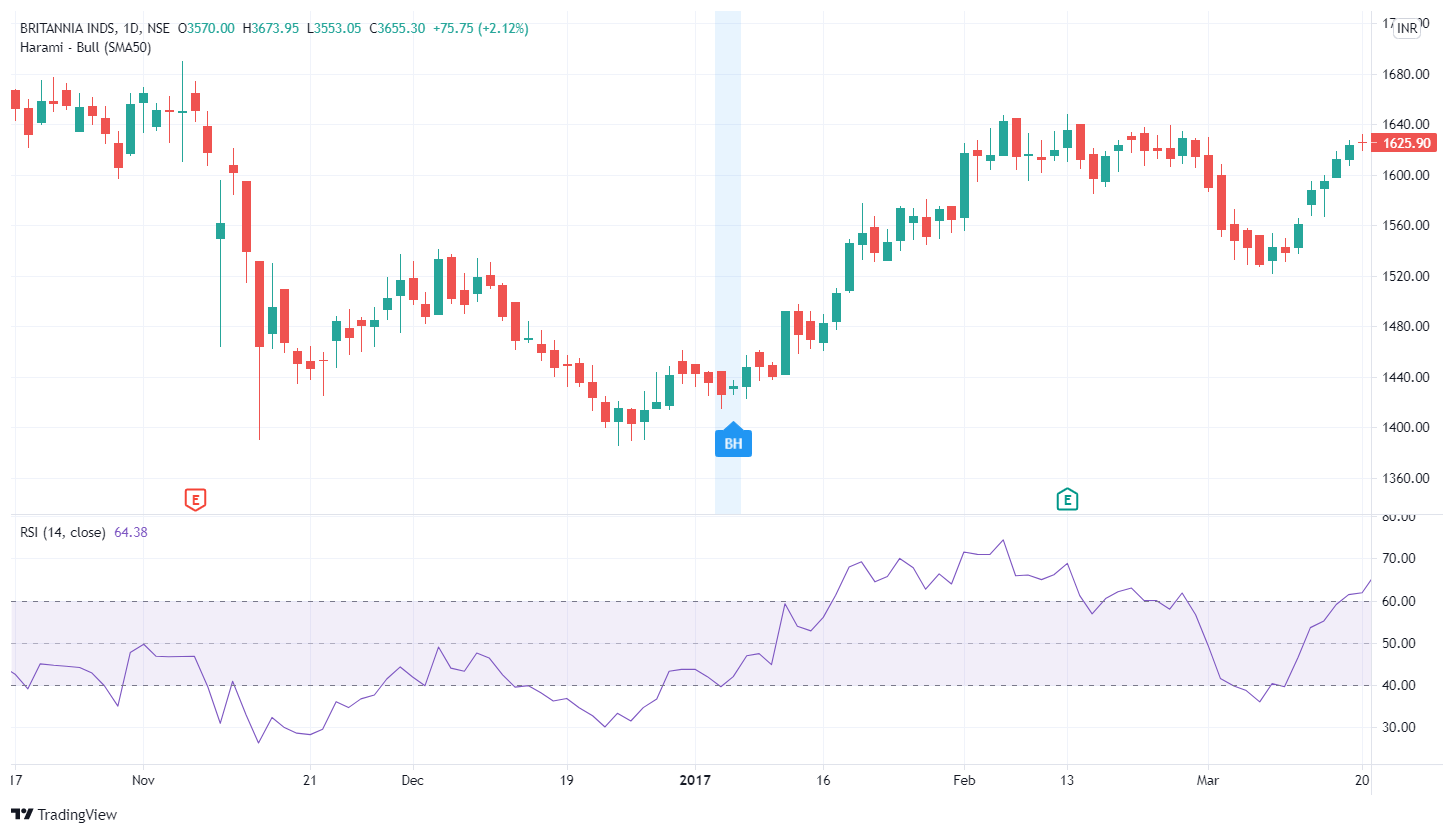
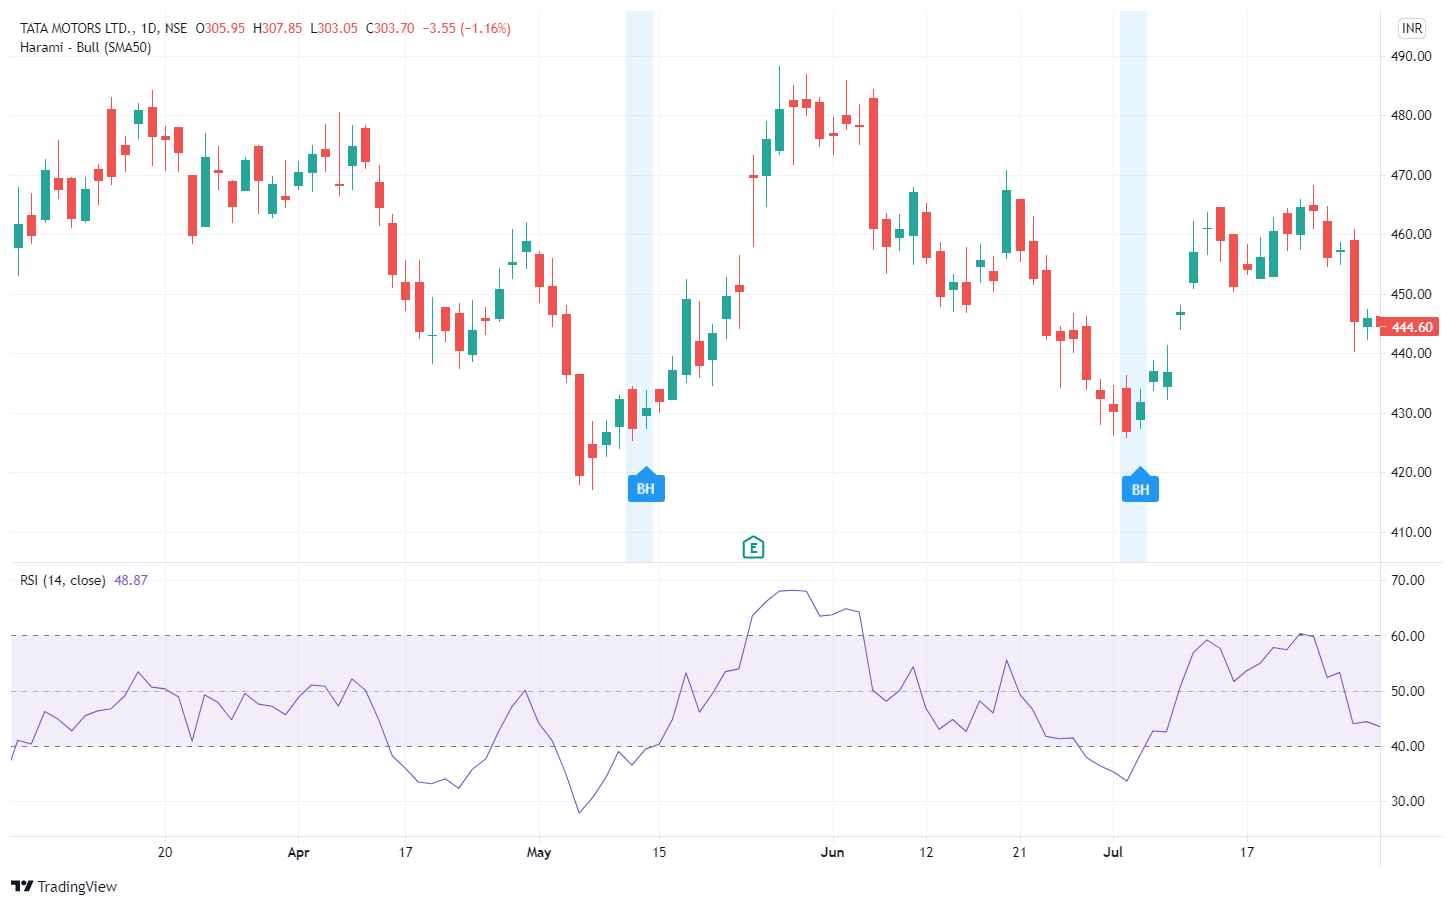
Some Harami patterns charts
BH indicator showed in the chart, zoom in to see a clear chart.
Bearish Harami Pattern
The Bearish Harami pattern is the opposite of the Bullish Harami. The first candle’s body is the same color as the current trend with a long body, whereas the second candle’s body is smaller. The second-day candle should be open and the close occurs inside the open and the close of the previous day.
Identify Bearish Harami candlestick Pattern
- The body of the first candle is Green and the body of the second candle is Red.
- A long Green candle occurs at the end of the trend.
- The second-day candle opens lower than the close of the previous day and closes higher than the opening of the prior day.
Strong chance of Bearish Harami Pattern works
- For a reversal signal, The next day should show weakness.
- The longer the green candle.
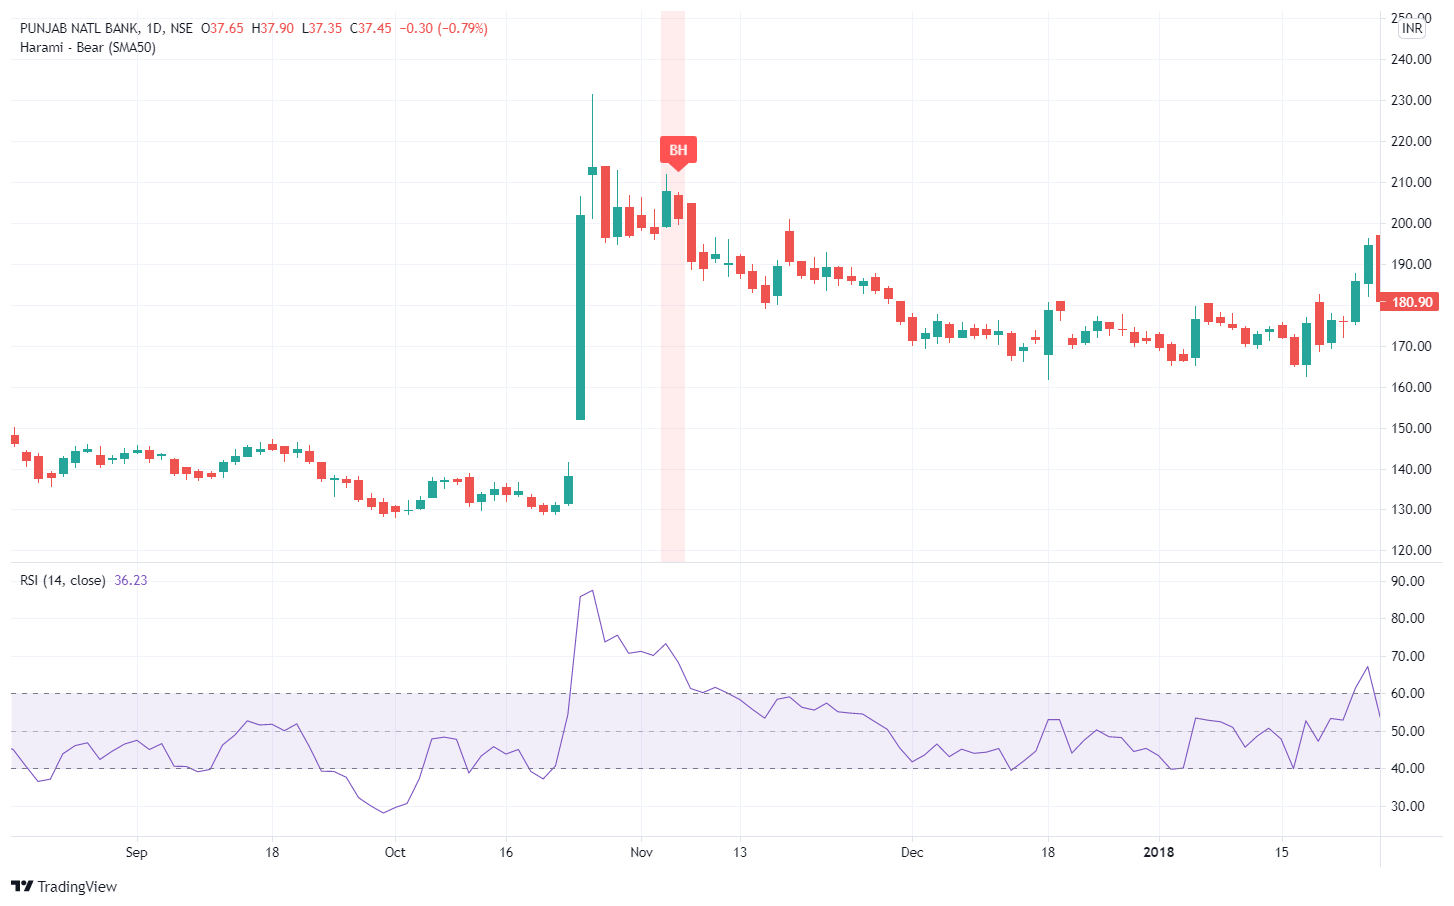
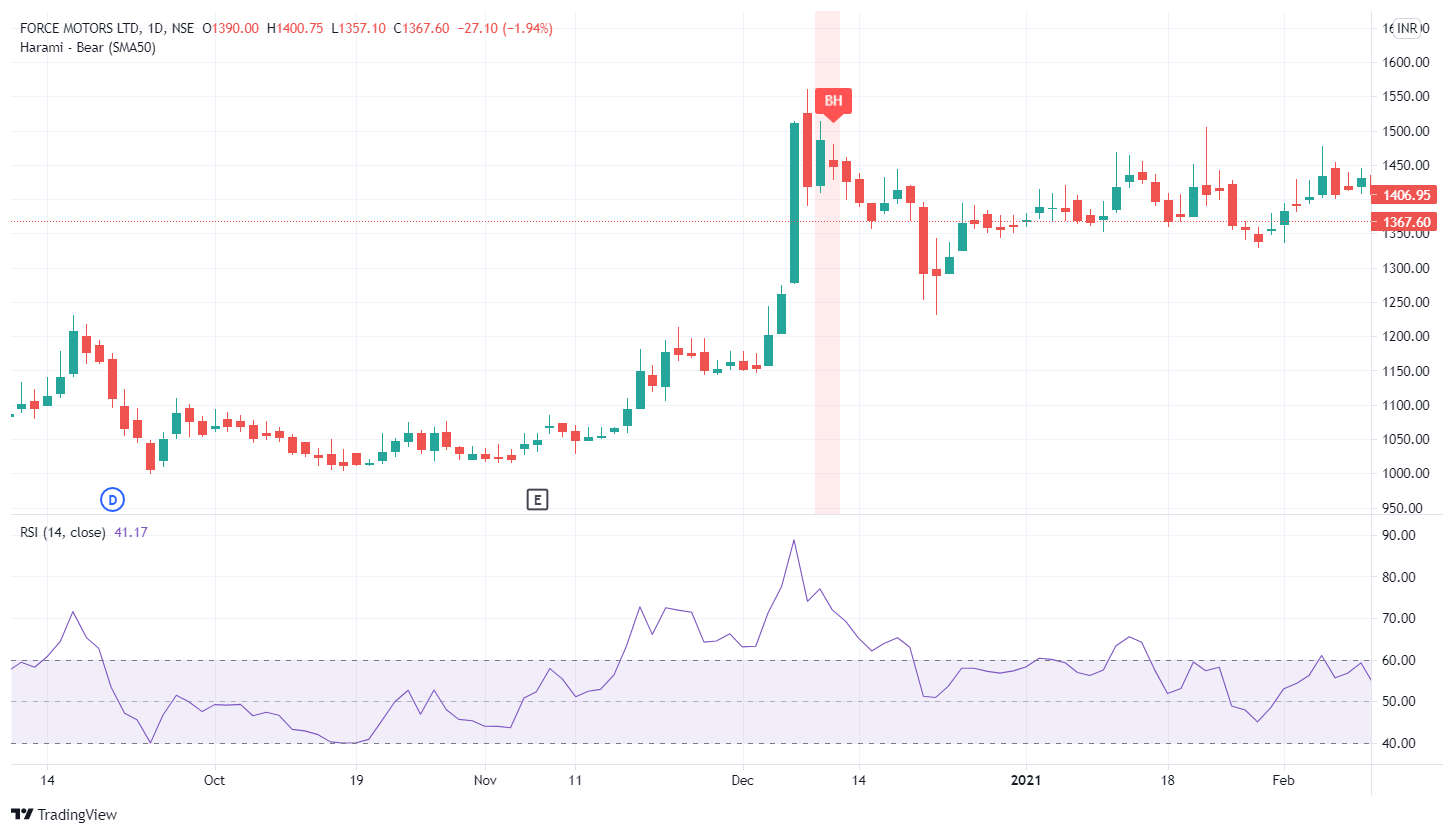
Some Bearsih patterns charts
Click to zoom in to see clear charts.
The Harami Candle pattern is not a very strong signal for a reversal trend. Where Dark clouds cover and Piercing line candlestick patterns are more reliable.
Disclaimer: All comapny chart are used only for learing purpose. There is no buy and sell recommandtion. All Technical analyst are learing purpose only.