
Doji Candle is created when the opening price and closing price are the same. It indicates the bulls and the bears are in a state of indecision. It can appear at both the top and bottom of trends.
If a Doji candlestick appears at the top of a trend, Doji signals a reversal without needing confirmation.
But if Doji occurs during the downtrend requires a bullish day to confirm.
How to Identify Doji
- The open and the close are the same or nearly the same.
- The length of the shadow should not be excessively long, especially when viewed at the end of a bullish trend
Strong Reversal chances with the DOJI candle
- Candle gap away from the previous day’s close.
- More volume on the signal day increases the chances
- If appears after a long candle body
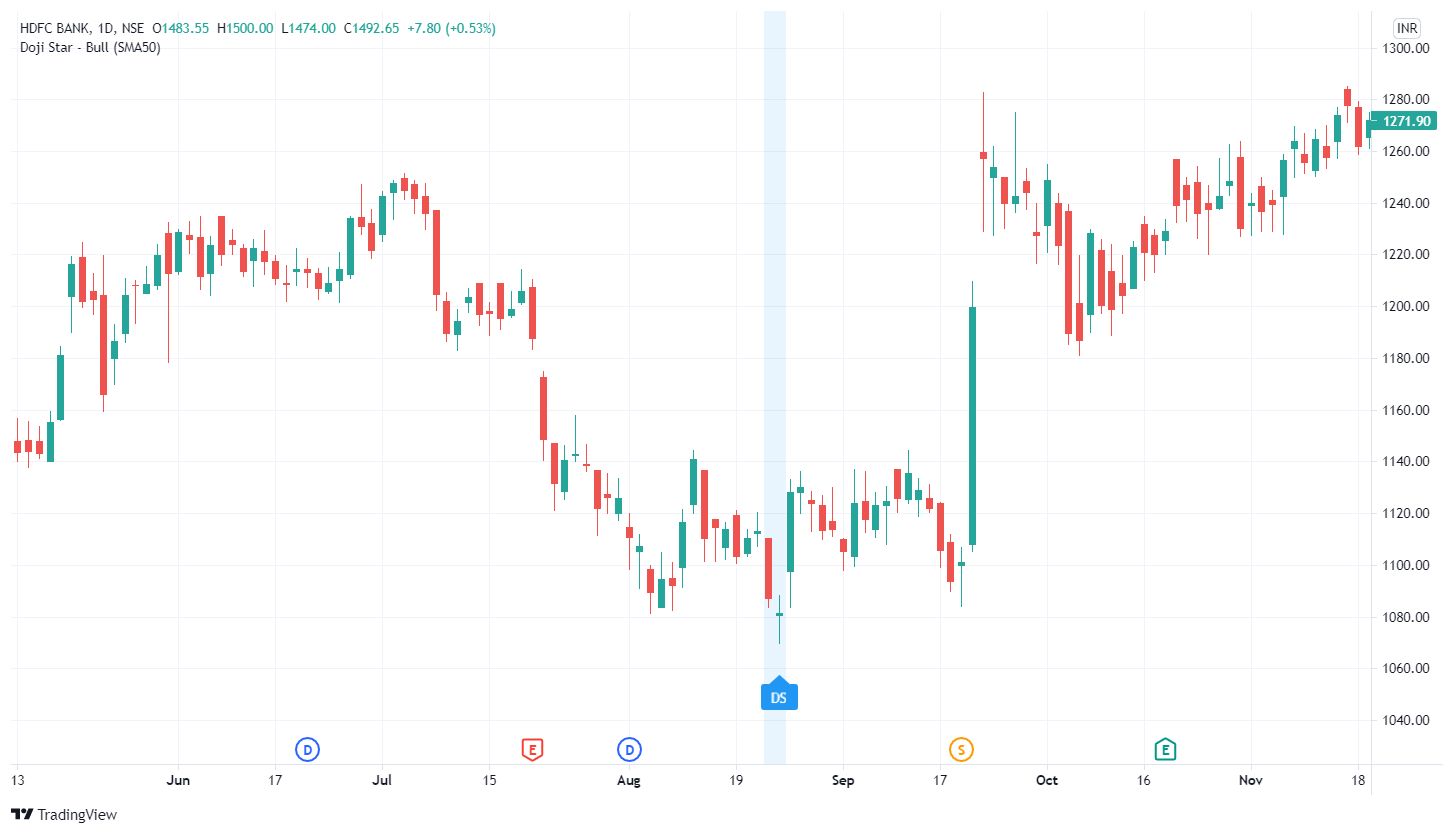
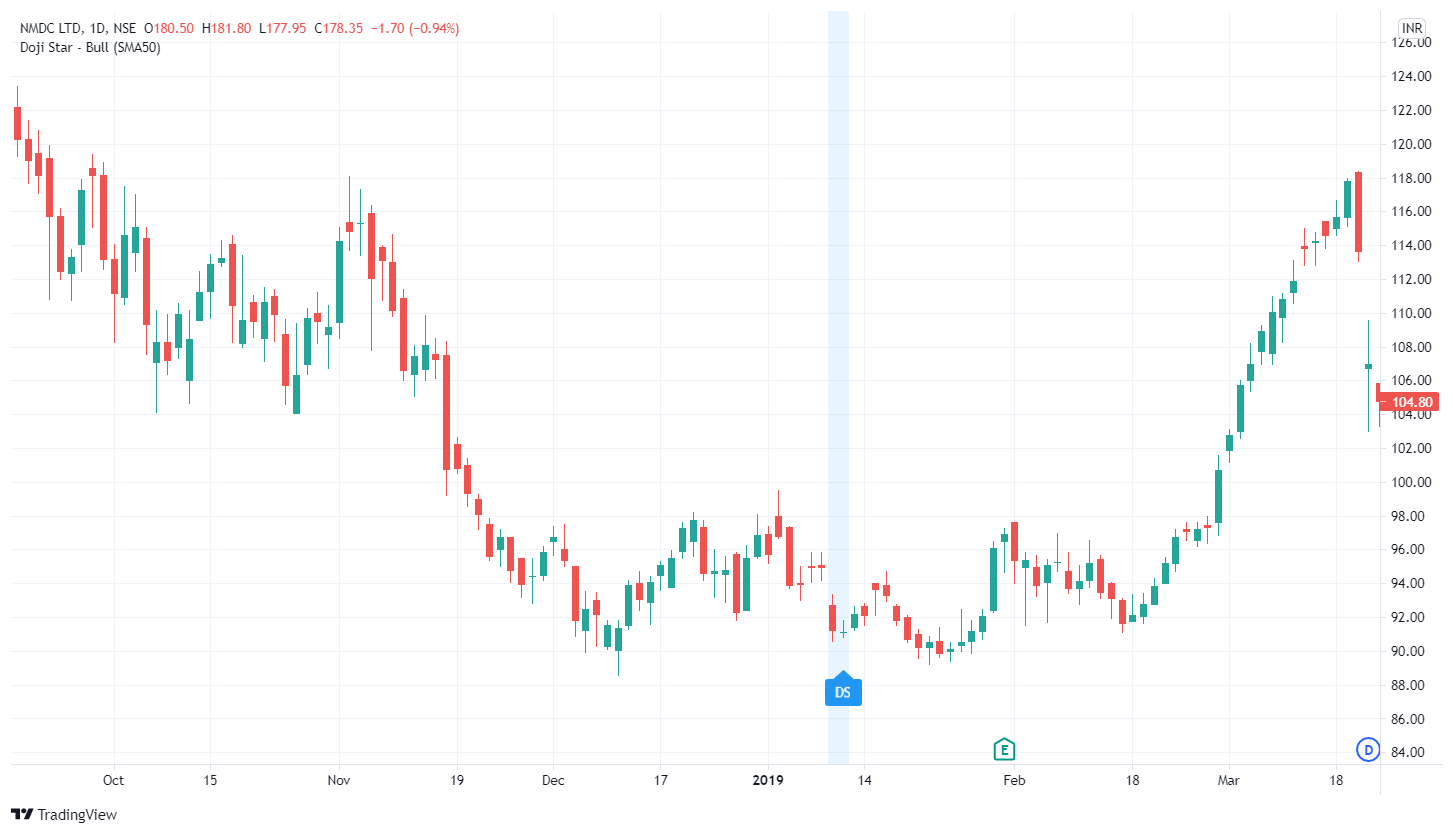
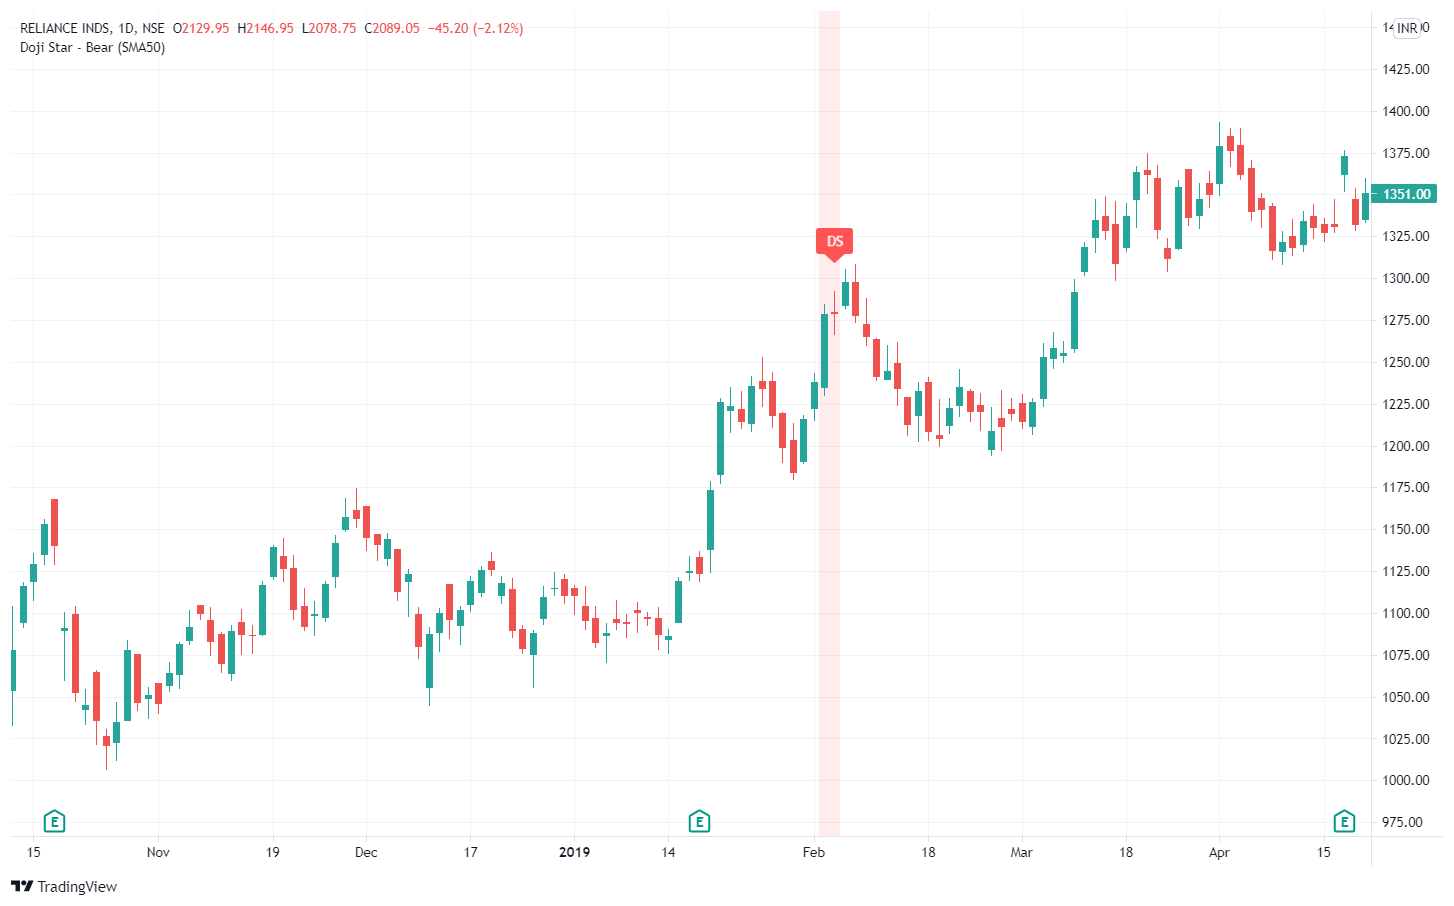
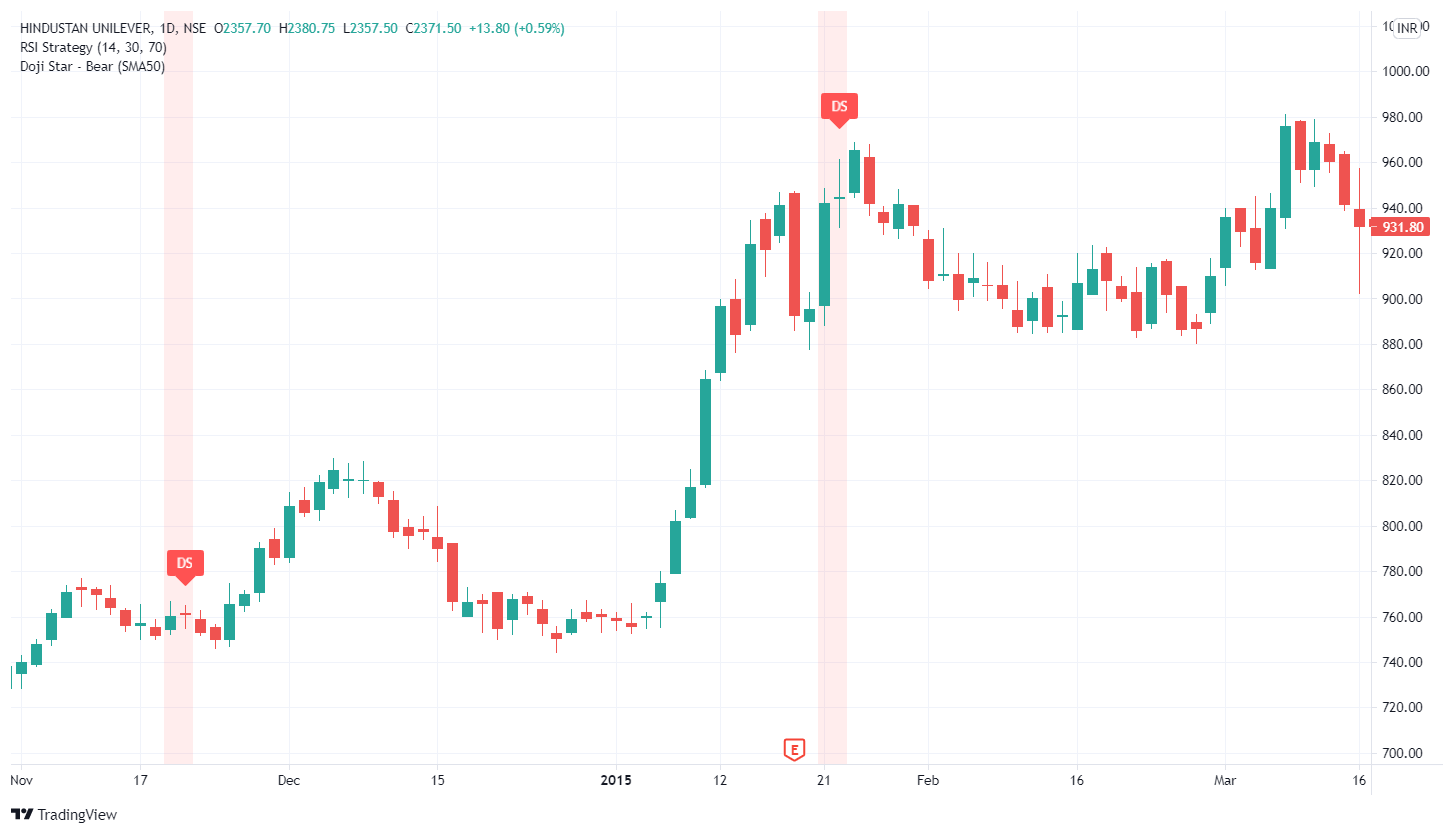
Real Chart of Doji Candle
Click on Image to view in Large.
Bullish Doji charts
Bearish Doji charts
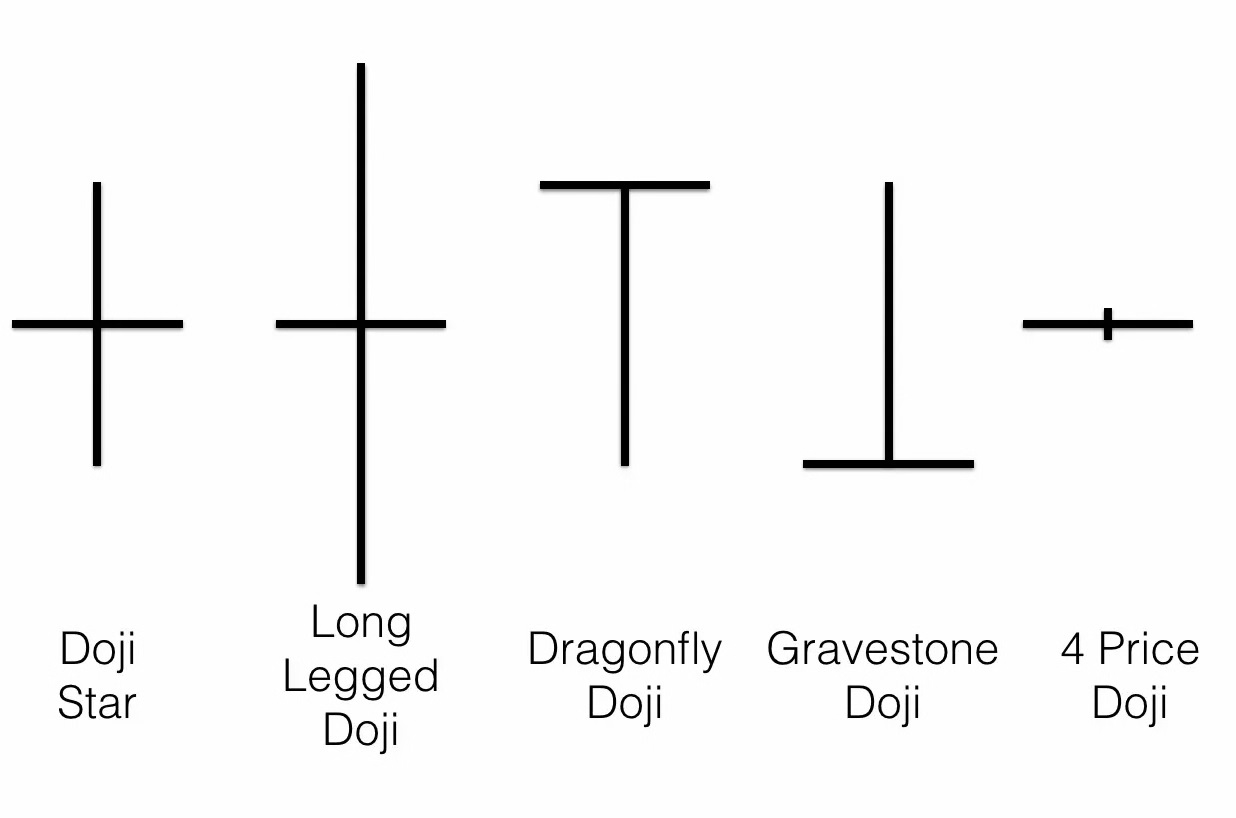
Type of Doji Candlesticks
- Long-Legged Doji
- Gravestone Doji
- Dragonfly Doji
Disclaimer: All comapny chart are used only for learing purpose. There is no buy and sell recommandtion. All Technical analyst are learing purpose only.