
A piercing Pattern is formed by two candlesticks, typically found on a daily timeframe. The first candlestick is a long red or black candlestick, indicating a strong bearish sentiment in the market.
The second candlestick opens lower than the first candlestick’s close but then closes more than halfway up the body of the first candlestick, creating a bullish candlestick with a long lower shadow.
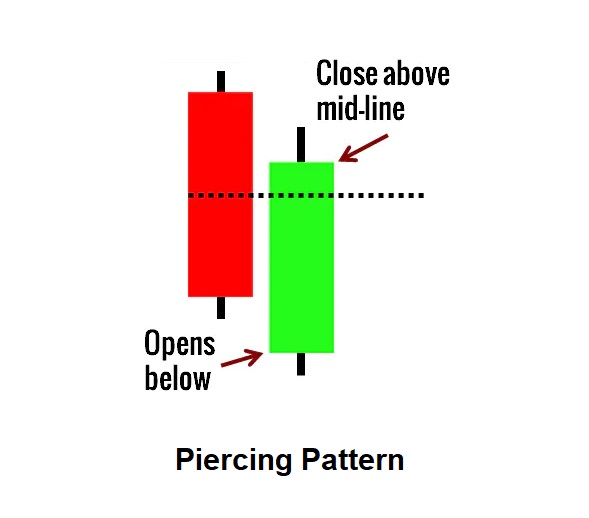
- The body of the first candle is red and the body of the second candle is green.
- The downtrend has been evident for a good period. A long Red candle occurs at the end of the trend.
- The second day opens lower than the trading of the prior day.
- The Green candle closes more than halfway up the Red candle.
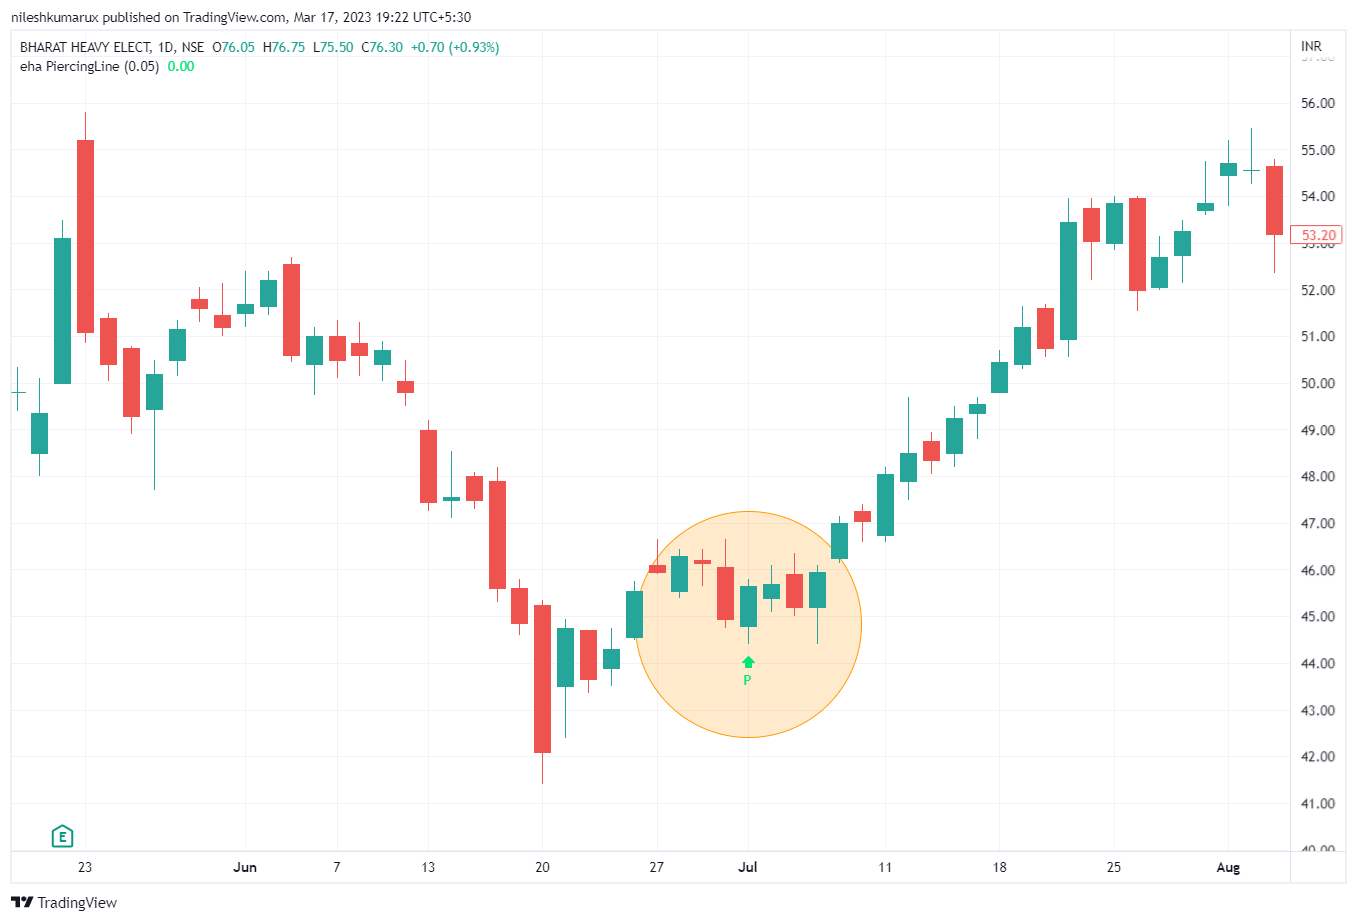
Piercing Pattern examples
Here is a chart with this pattern.
BHEL
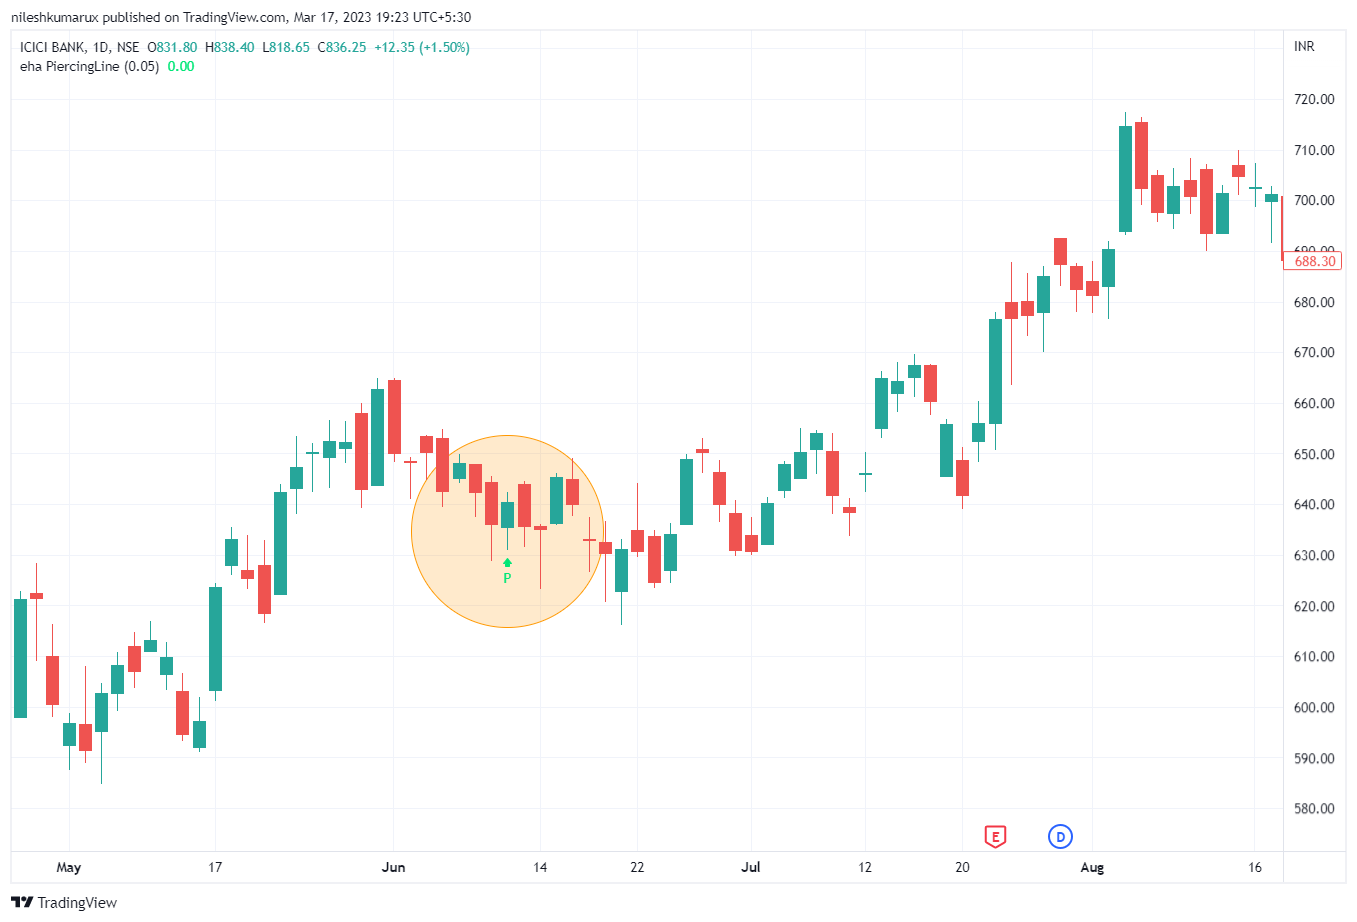
ICICI Bank
Note: This pattern is not given the surety of trend reversal, it should be used with other technical indicators and analysis to confirm the trend reversal.
Disclaimer: All comapny chart are used only for learing purpose. There is no buy and sell recommandtion. All Technical analyst are learing purpose only.