
Dragonfly Doji Candlestick is a bullish reversal pattern when it appears at the bottom of a downtrend. It appears in stock charts and is used by technical analysts to predict future price movements.
The Dragonfly Doji occurs when trading opens, trades lower, and then closes at the open price which is the high of the day. At the top of the market, it becomes a variation of the Hanging Man. At the bottom of a trend, it becomes a specific Hammer.
On the other hand, if the Dragonfly Doji appears during an uptrend, it may suggest a potential trend reversal to the downside.
Dragonfly Doji Candlestick example
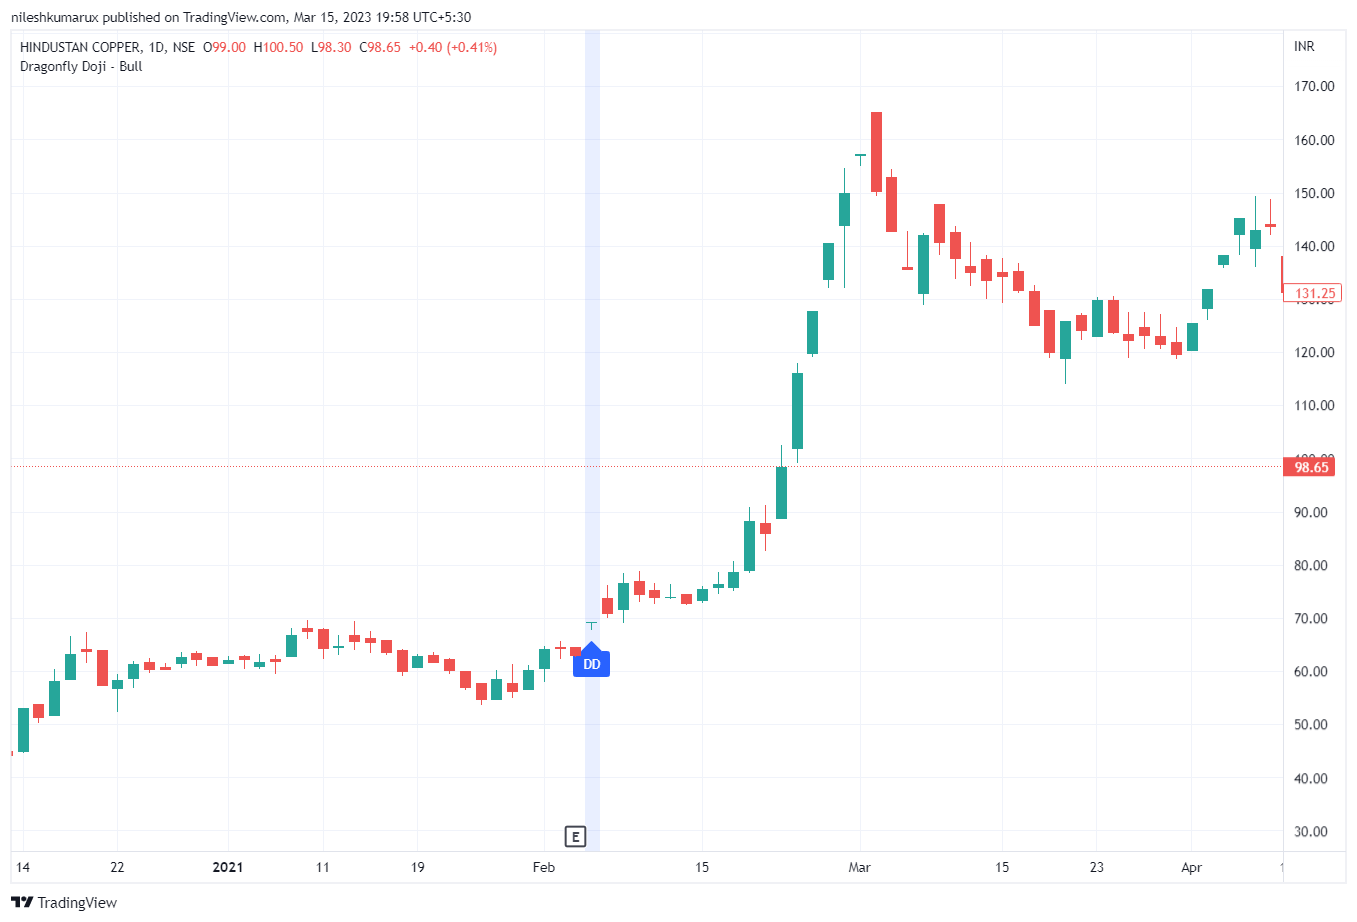
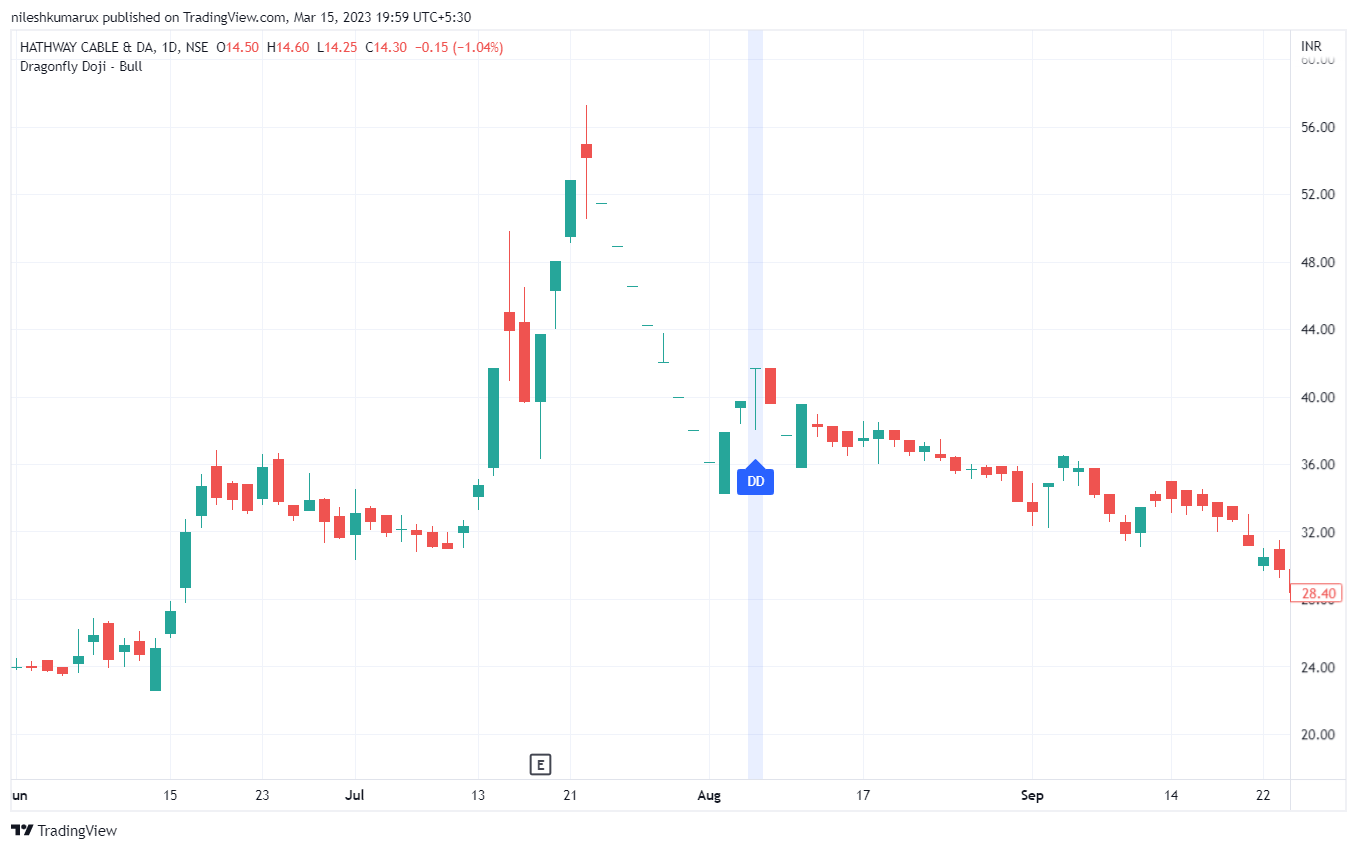
Here is a sample chart with Dragonfly Doji Candle.
HINDCOPPER
HATHWAY
Note: Even if this candlestick shows a potential change in momentum and a possible trend reversal you have to confirm this pattern with other technical indicators or chart patterns before making any trading decisions.
Disclaimer: All comapny chart are used only for learing purpose. There is no buy and sell recommandtion. All Technical analyst are learing purpose only.