
DOJI star is a single candle pattern and it is used as a reversal of stock trends by traders. This candlestick is called Doji Star when a candlestick has a small real body.
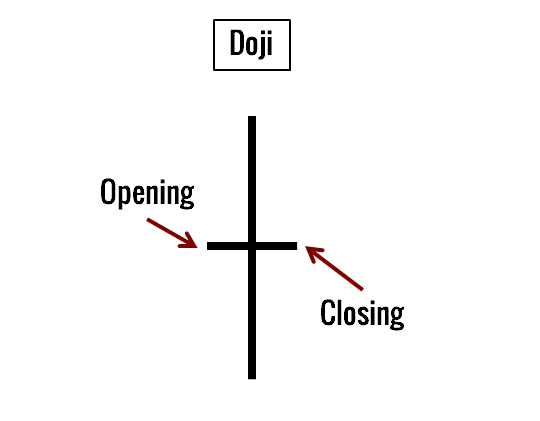
This candle stick showed the open and close prices are very close or the same. This pattern is considered a reversal pattern, meaning it could signal a potential trend change in the market.
It is important at both the top and bottom of trends. At the top of a trend, the Doji signals a reversal without needing confirmation
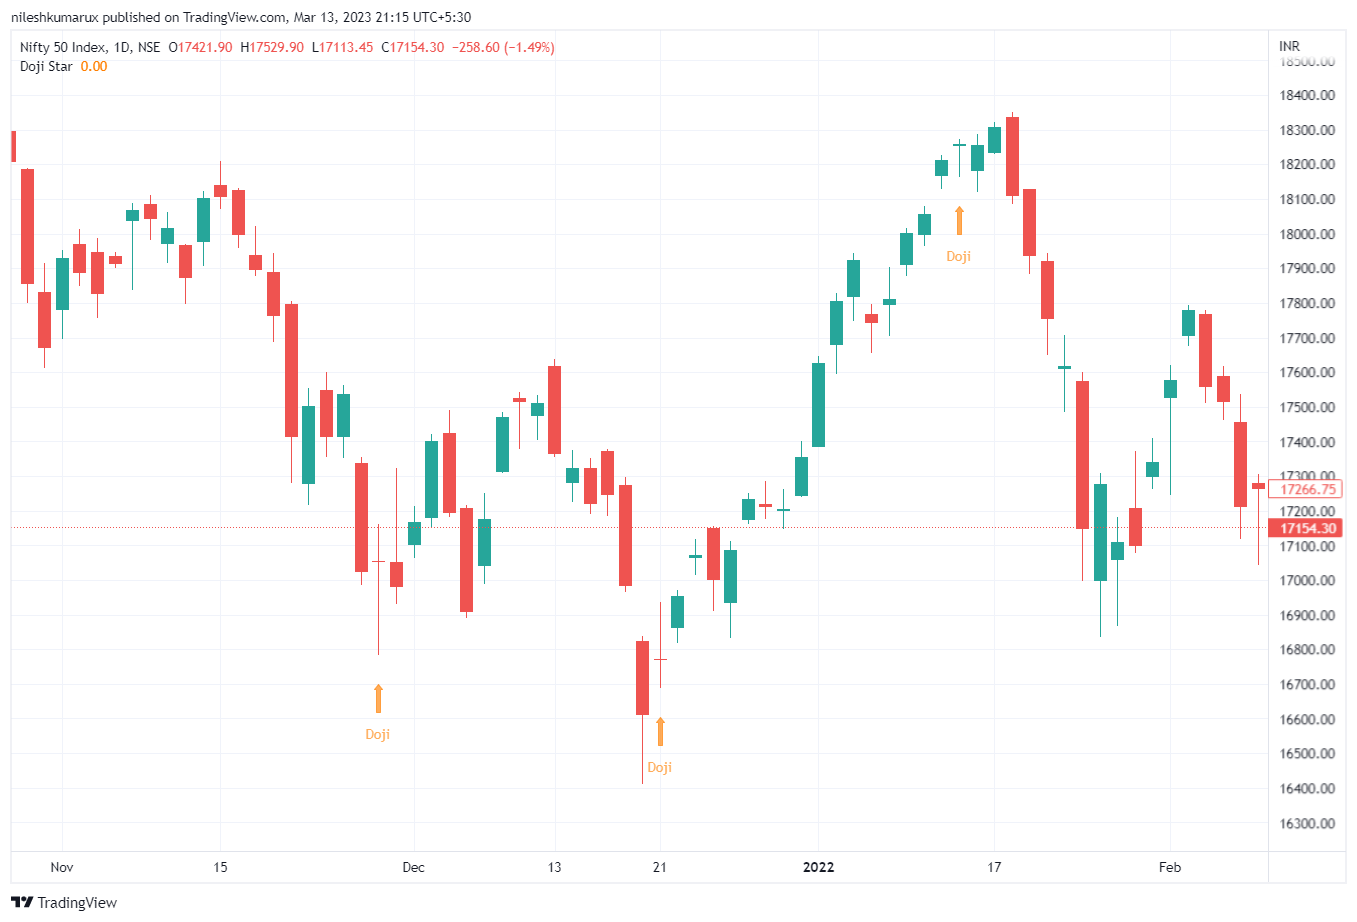
DOJI STAR Candlestick pattern examples
Here is some stock with examples of how this pattern appears in the chart.
You must wait for the next day’s confirmation of a trend reversal before making a trade based on this pattern. A Large volume on the signal day increases the chances that a blowoff day has occurred, although it is not a necessity.
Are hammer and doji the same?
Answer: No, Hammer and Doji are two different candlestick patterns.
A Hammer is a bullish reversal candlestick pattern that consists of a small body at the upper end of the candlestick range with a long lower shadow, indicating that buyers pushed prices up after an initial sell-off. The shape of the hammer pattern resembles a hammer with a long handle and a small head, hence its name. A hammer pattern is generally considered to be a bullish signal. Read more…
The Doji is a candlestick pattern where the opening and closing prices are the same or very close, resulting in a small or nonexistent body with long upper and lower shadows. The Doji represents market indecision and is often seen as a signal of a potential trend reversal. There are different types of Doji candlestick patterns, such as the long-legged Doji, gravestone Doji, and dragonfly Doji.
Do comment if you have any doubts or suggestions on this candlestick pattern topic.
Disclaimer: All comapny chart are used only for learing purpose. There is no buy and sell recommandtion. All Technical analyst are learing purpose only.