
Three Black Crows Pattern is a bearish reversal pattern. It formed consists of three consecutive long-bodied bearish candles with each closing near the day’s low, and each opening within the body of the previous candle.
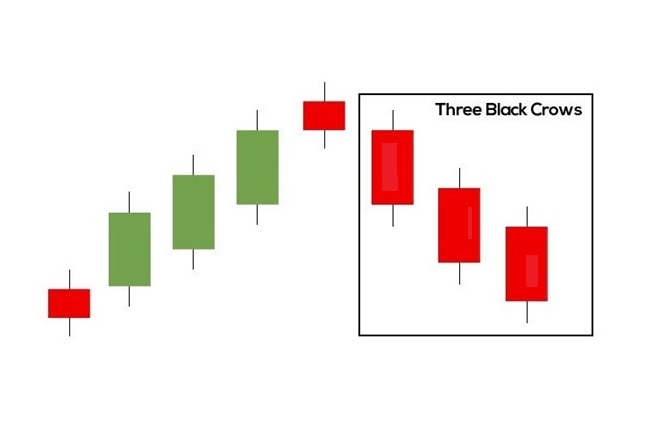
You can take a trade based on this pattern because it often signals a reversal of an uptrend, and the bears are taking control of the market. But you should use other indicators and analysis to confirm a trend reversal.
Three Black Crows Pattern example
Let’s see some chart patterns for this.
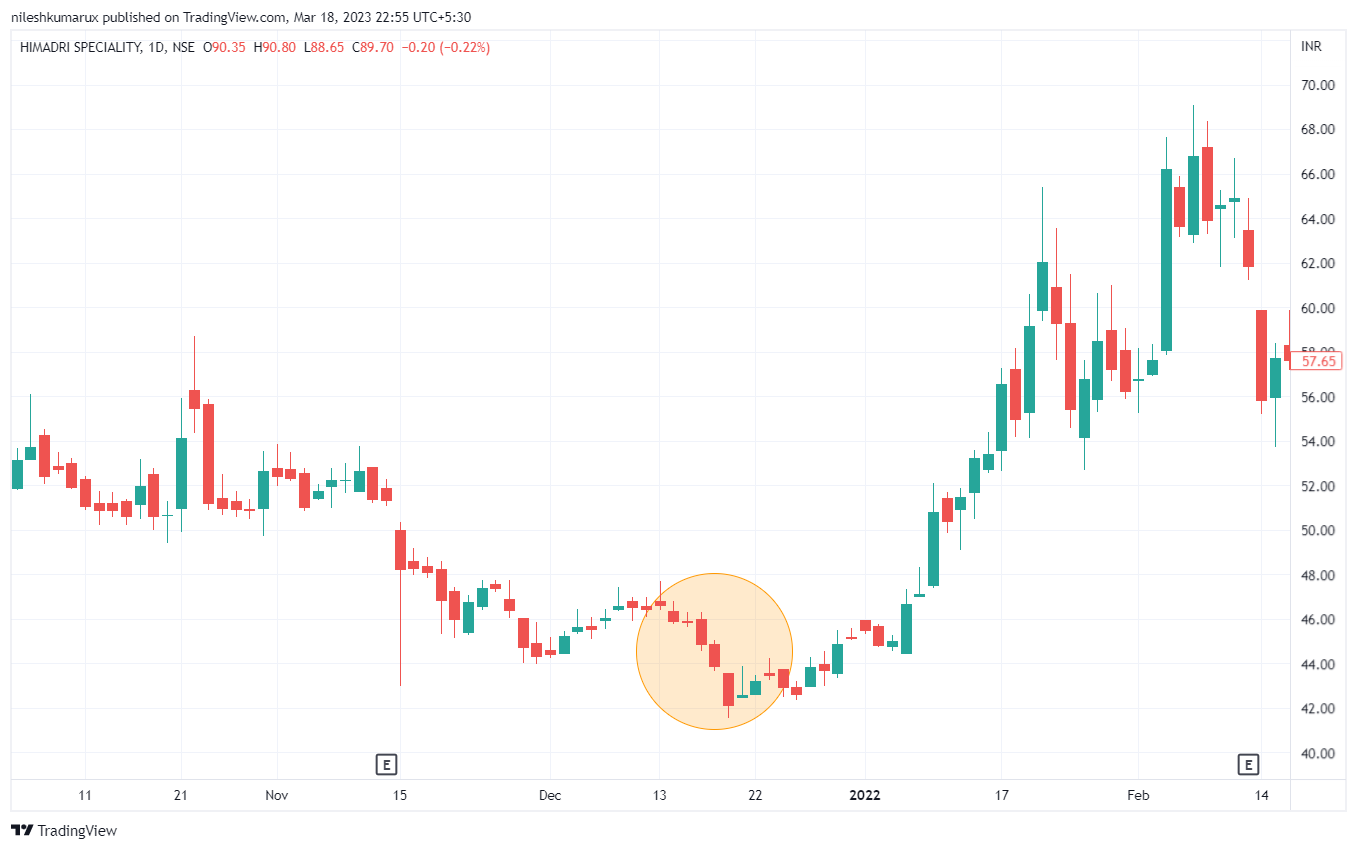
HSCL
IDBI
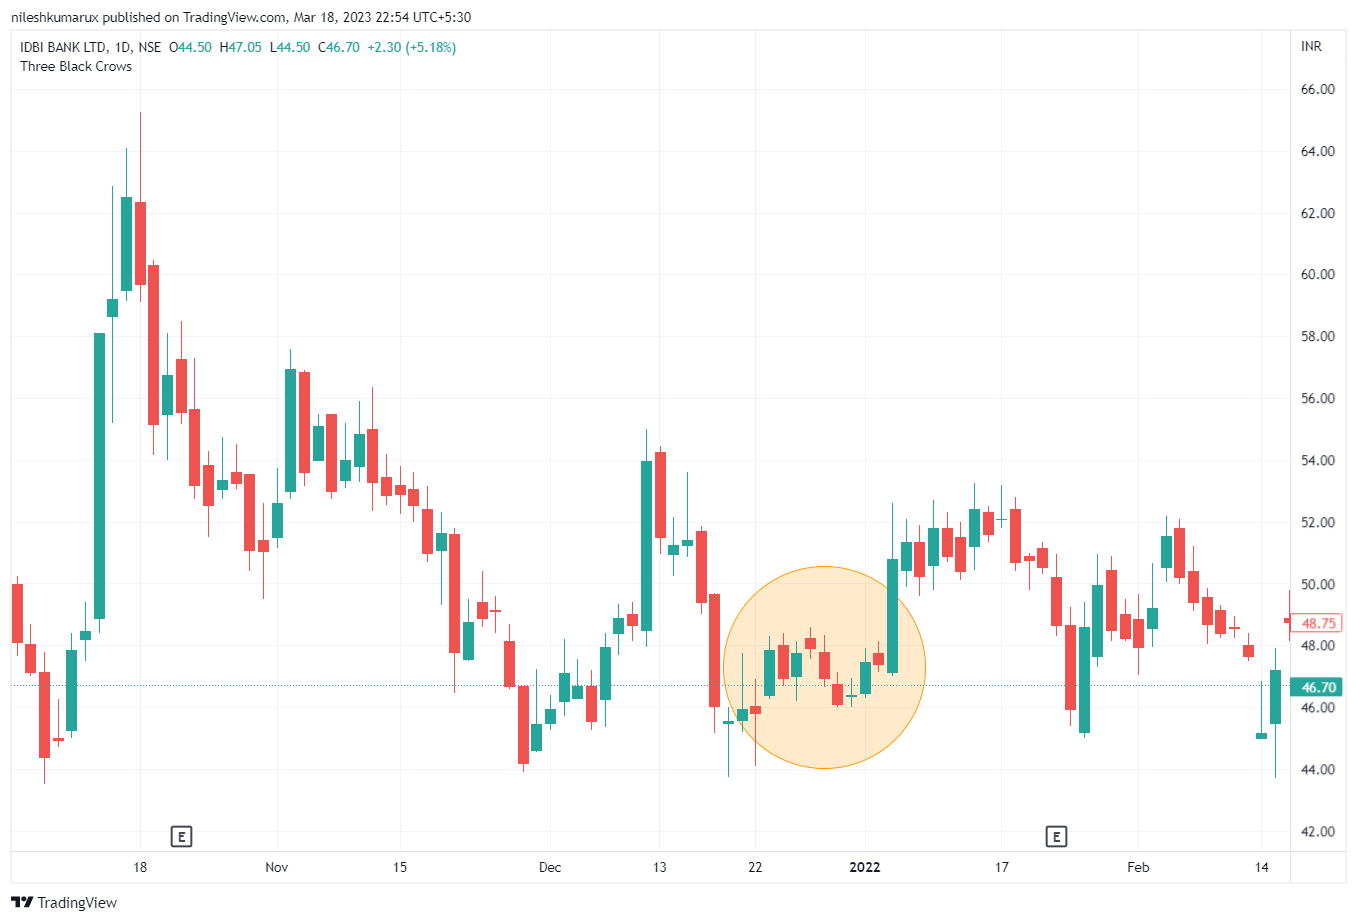
Traders often use this pattern as a signal to sell their positions or to take a short position in the market, expecting further price declines but you can see above the examples it’s not give always the right signal.
Disclaimer: All comapny chart are used only for learing purpose. There is no buy and sell recommandtion. All Technical analyst are learing purpose only.