
The Separating Lines candlestick pattern is a neutral pattern consisting of two candlesticks that have the same high or low price level. While it does not give a clear indication of trend continuation or reversal, it can be a useful signal for traders, especially when it occurs after a strong trend.
It is possible to predict a continuation of either a bullish or a bearish trend, based on the heights and arrangement of the candlesticks.
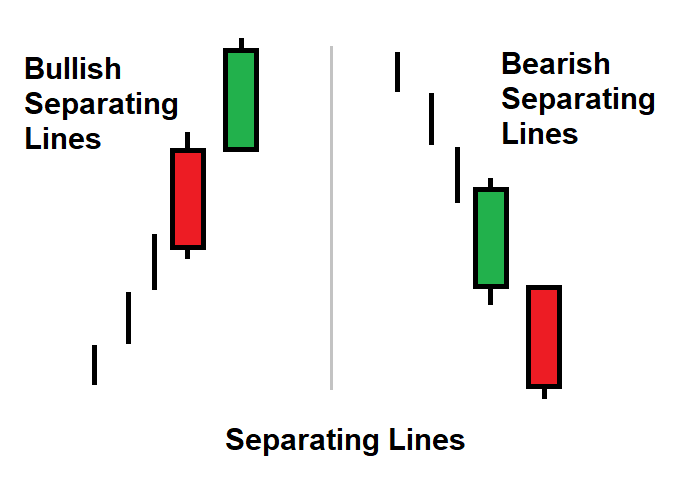
If the following conditions are met, it can be identified that a bearish Separating Lines candlestick pattern has formed:
- A long bullish candle appears after a downtrend as the first candle.
- The second candle is long and bearish, with an Open price that is the same as the Close price of the first candle.
- The second candle has no upper shadow.
And bullish Separating Lines candlestick pattern has formed:
- A long bearish candle appears after an uptrend as the first candle.
- The second candle is long and bullish, with an Open price that is equal to the Close price of the first candle.
- The second candle has no lower shadow.
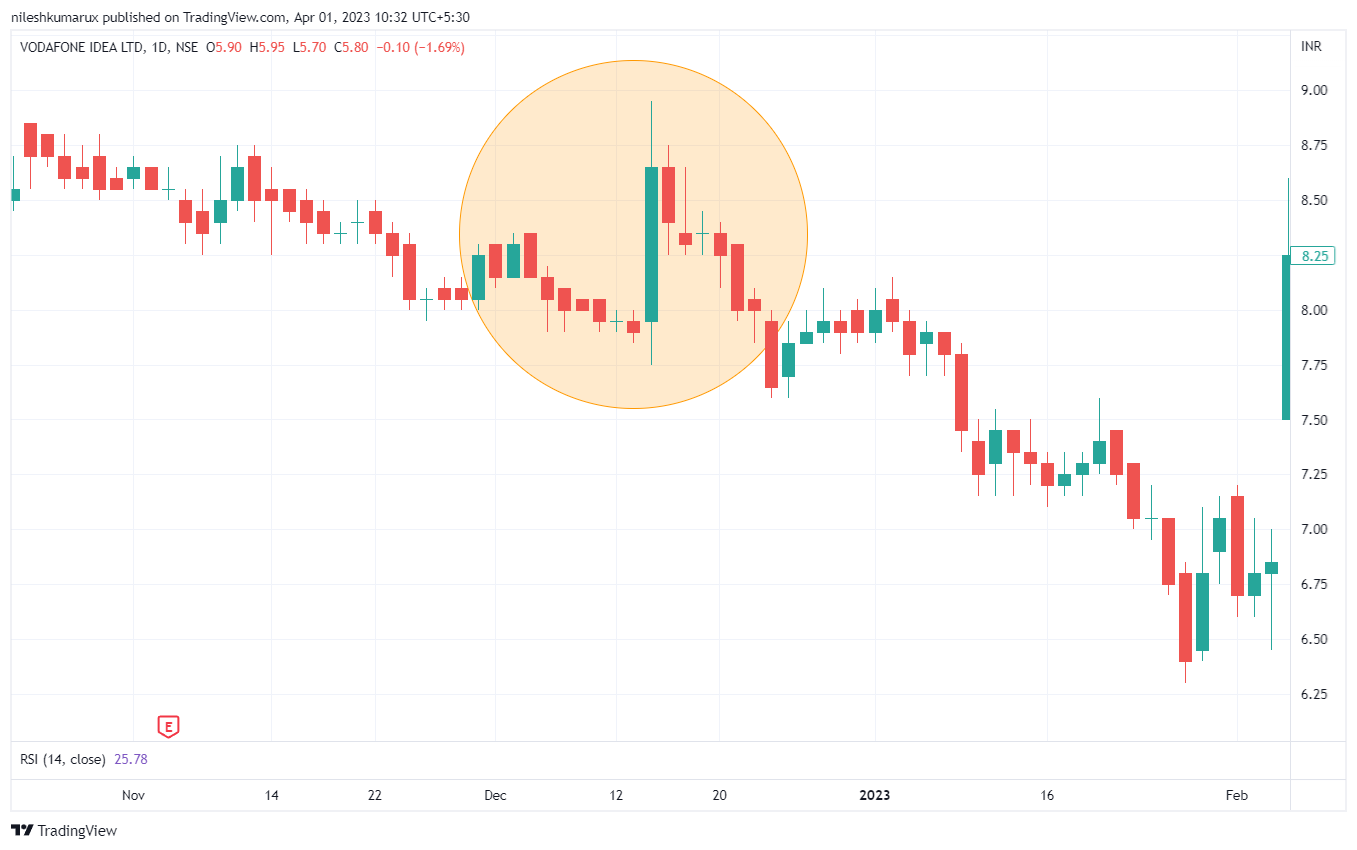
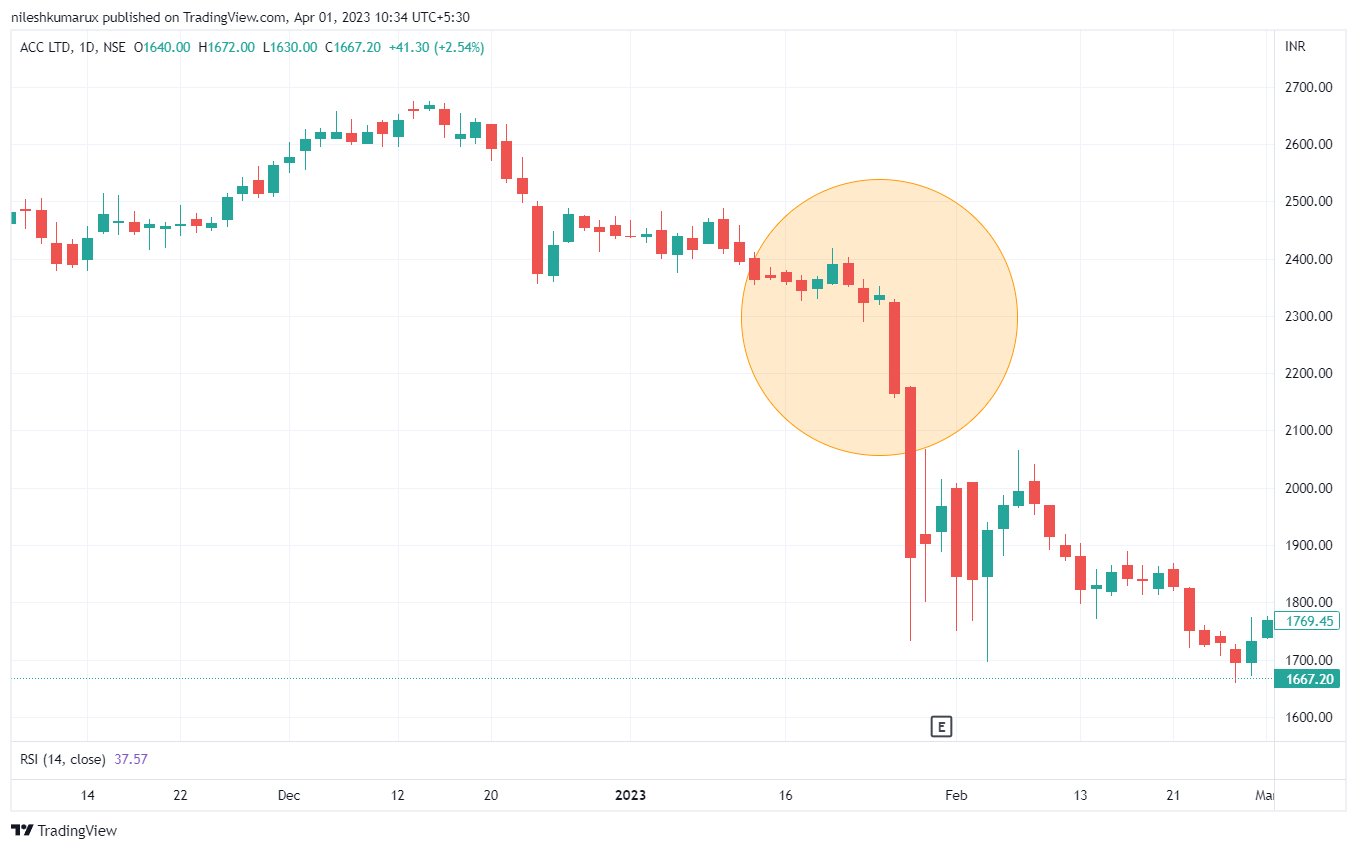
Separating Lines candlestick pattern example
Here are charts for this pattern.
Bullish Separating Lines

Bearish Separating Lines

This pattern is considered a neutral pattern, as it does not give a clear indication of whether the trend will continue or reverse. However, it can be an important signal for traders to pay attention to, especially when it occurs after a strong trend.
Disclaimer: All comapny chart are used only for learing purpose. There is no buy and sell recommandtion. All Technical analyst are learing purpose only.