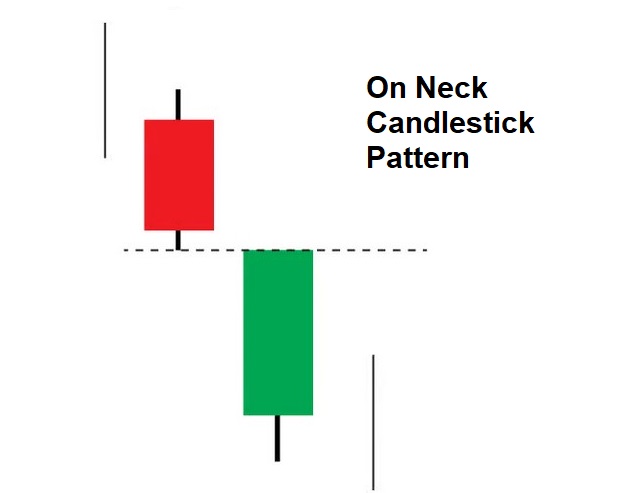
On Neck Candlestick Pattern is a two-candlestick pattern used in technical analysis. This chart pattern resembles two candlesticks that seem to be catching each other’s necks.

The first red candle appears followed by a green candle that closes on the neckline, which is formed where the two candles finish after closing.
The on-neck candlestick pattern typically emerges in a bearish market trend, and its appearance confirms the continuation of the downtrend. Therefore, traders who are currently in bearish positions can use this pattern to reinforce their bearish positions.
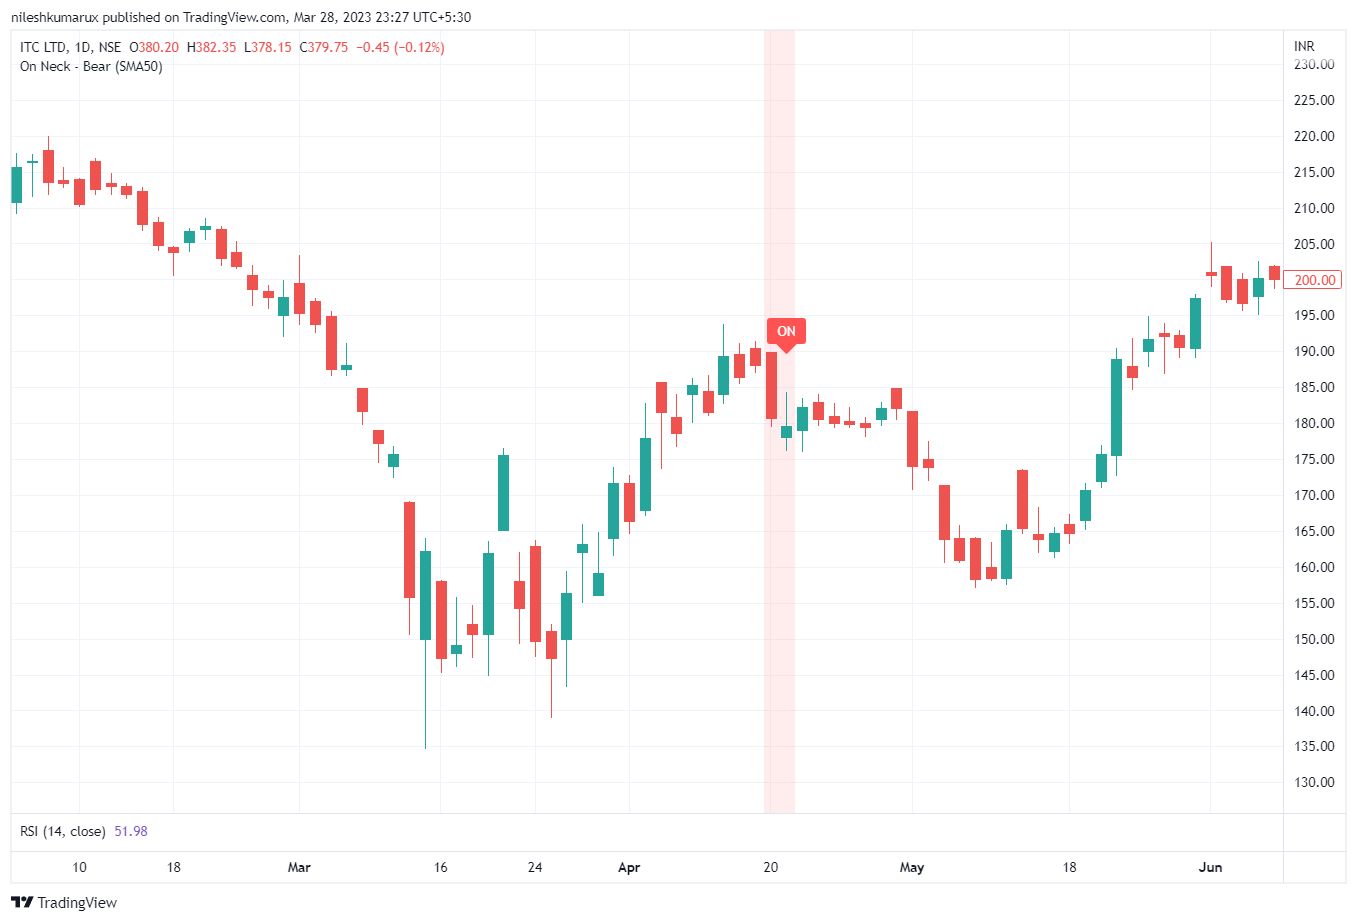
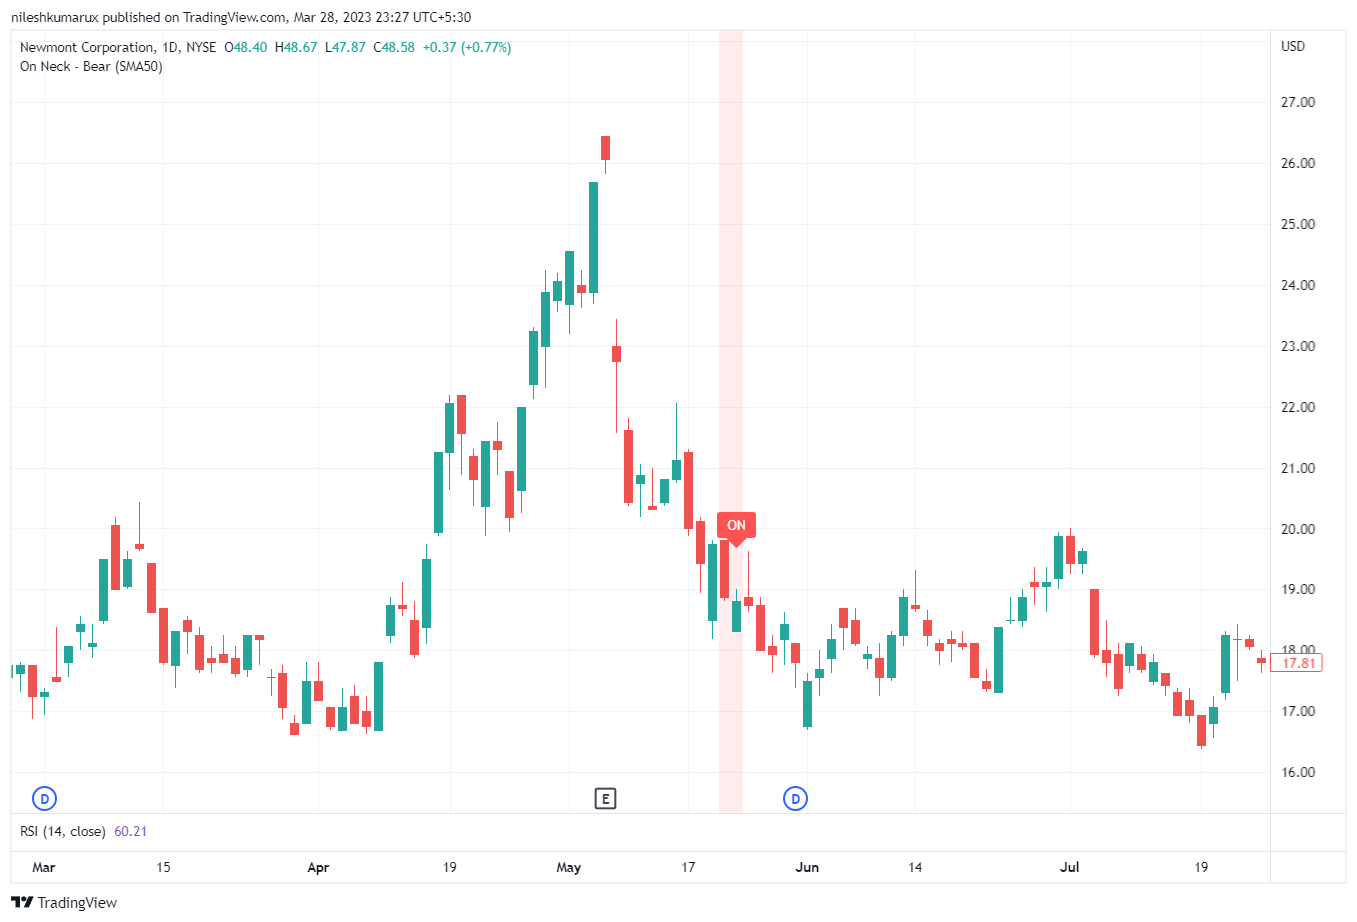
On Neck Candlestick Pattern example
Let’s see some real charts with this pattern.


The on-neck pattern appears in a bearish trend. In this pattern, a green candle appears after a red candle as the market is descending, and it closes at the same price level as the preceding red candle. It is noteworthy that the size of the candles or their wicks is not relevant in this pattern.
Note: No technical analysis pattern or indicator can guarantee absolute accuracy, and traders must implement appropriate risk management strategies and set stop-loss orders while trading.
Disclaimer: All comapny chart are used only for learing purpose. There is no buy and sell recommandtion. All Technical analyst are learing purpose only.