
Matching High candlestick patterns indicate a potential reversal of an uptrend or the start of a downtrend. This pattern occurs when two or more candlesticks have the same high price.
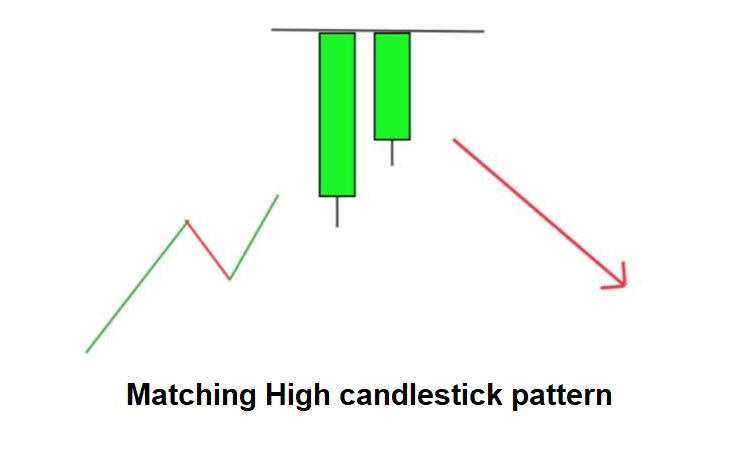
To identify a matching high pattern, look for two or more consecutive candlesticks with the same high price. The pattern can occur at the end of an uptrend or after a period of consolidation.
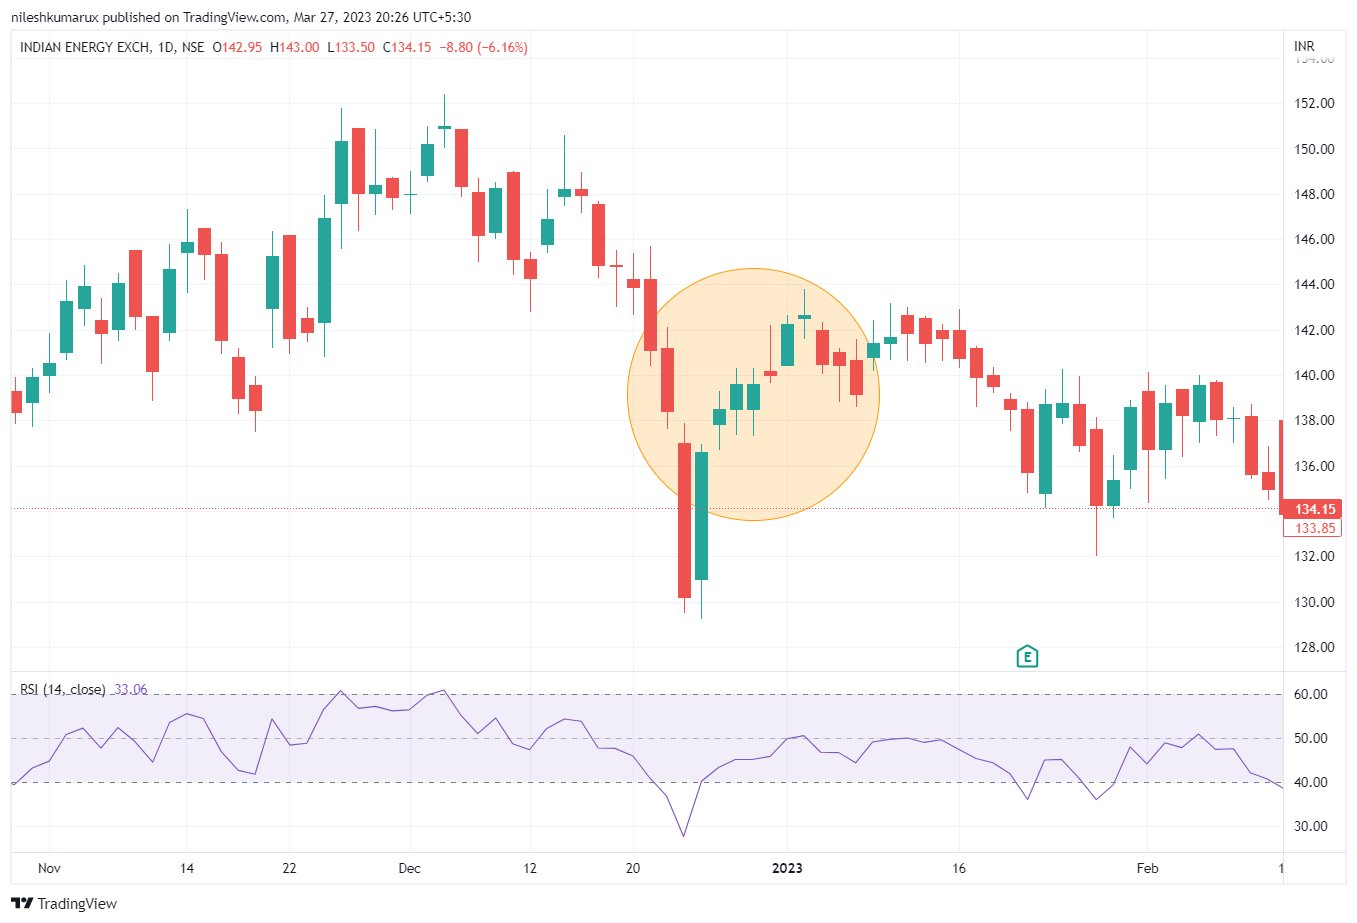
Matching High candlestick pattern example
Let’s see this chart pattern.
This technical analysis pattern can be used by traders to make trading decisions but should be used with other technical indicators and analysis, as well as consideration of market conditions and overall trends.
Disclaimer: All comapny chart are used only for learing purpose. There is no buy and sell recommandtion. All Technical analyst are learing purpose only.