
Ladder Bottom Candlestick Pattern is a bullish reversal candlestick pattern that can be found at the bottom of a downtrend. It is a five-candlestick pattern that occurs at the end of a bullish trend.
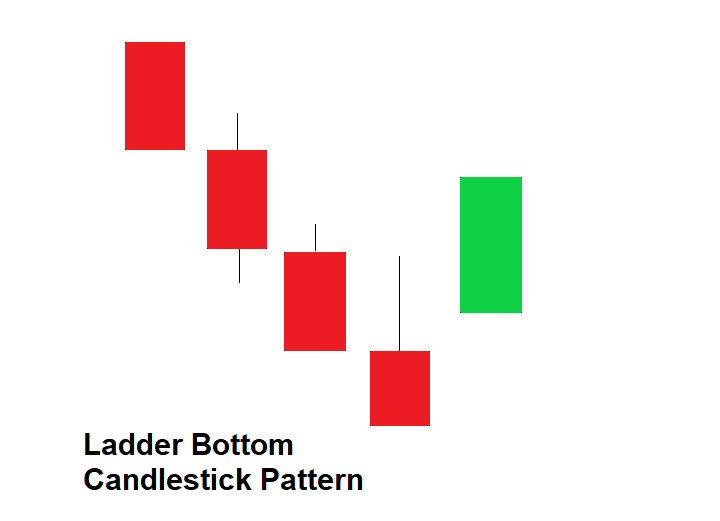
The pattern consists of a long red candlestick, followed by a series of smaller candlesticks with gradually decreasing lows, and finally, a long green candlestick that closes above the highs of the previous candlesticks.
You can identify it by:
- The pattern occurs at the end of a downtrend, signaling a potential reversal in the market.
- The first candlestick in the pattern is a long red candlestick, indicating strong selling pressure.
- The following candlesticks are smaller and have gradually decreasing lows, indicating a weakening of the selling pressure.
- The final candlestick in the pattern is a long green candlestick, indicating strong buying pressure that has overcome the selling pressure of the earlier candlesticks.
- The green candlestick closes above the highs of the previous candlesticks, confirming the reversal in the market.
Ladder Bottom Candlestick Pattern example
Let’s see some charts which have this pattern.
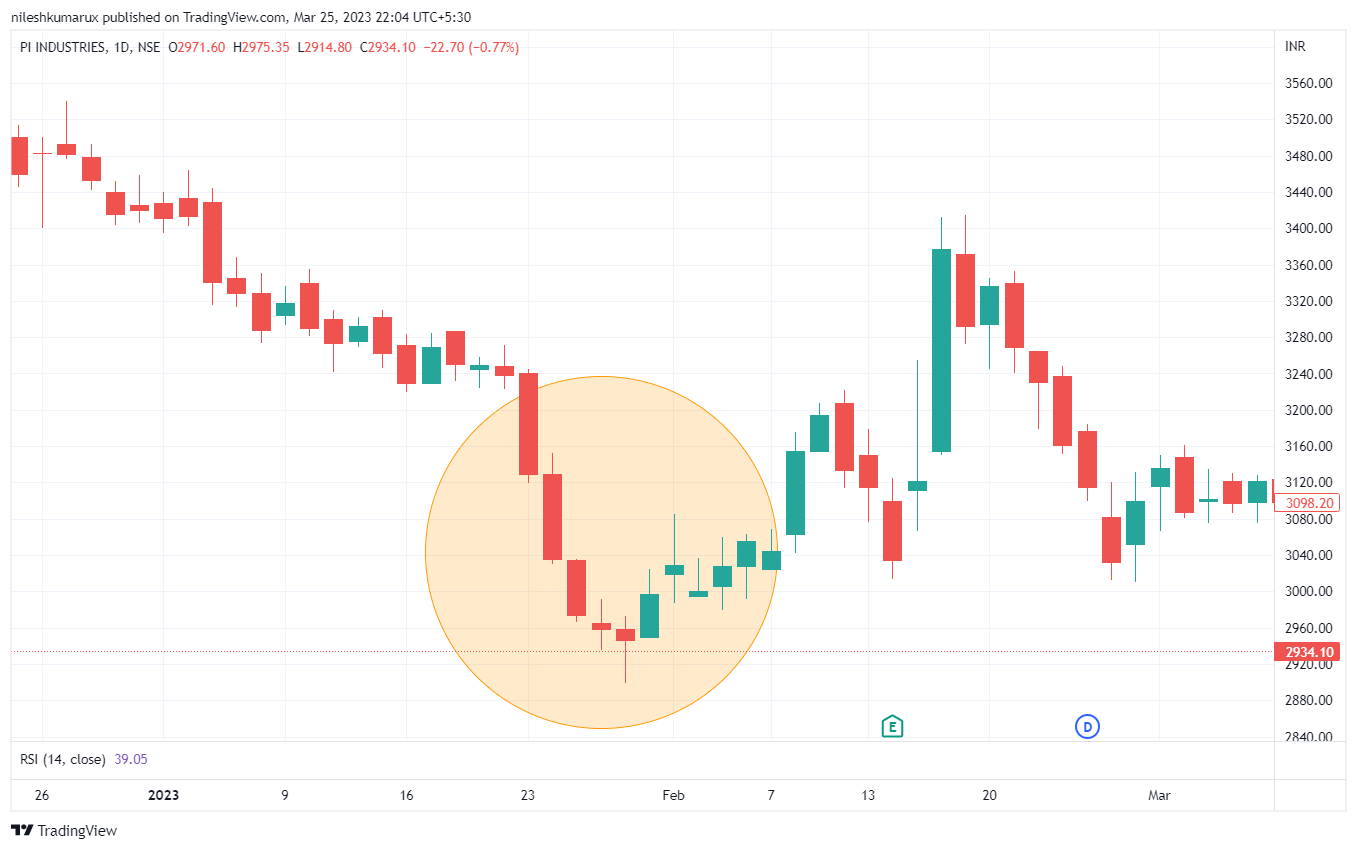
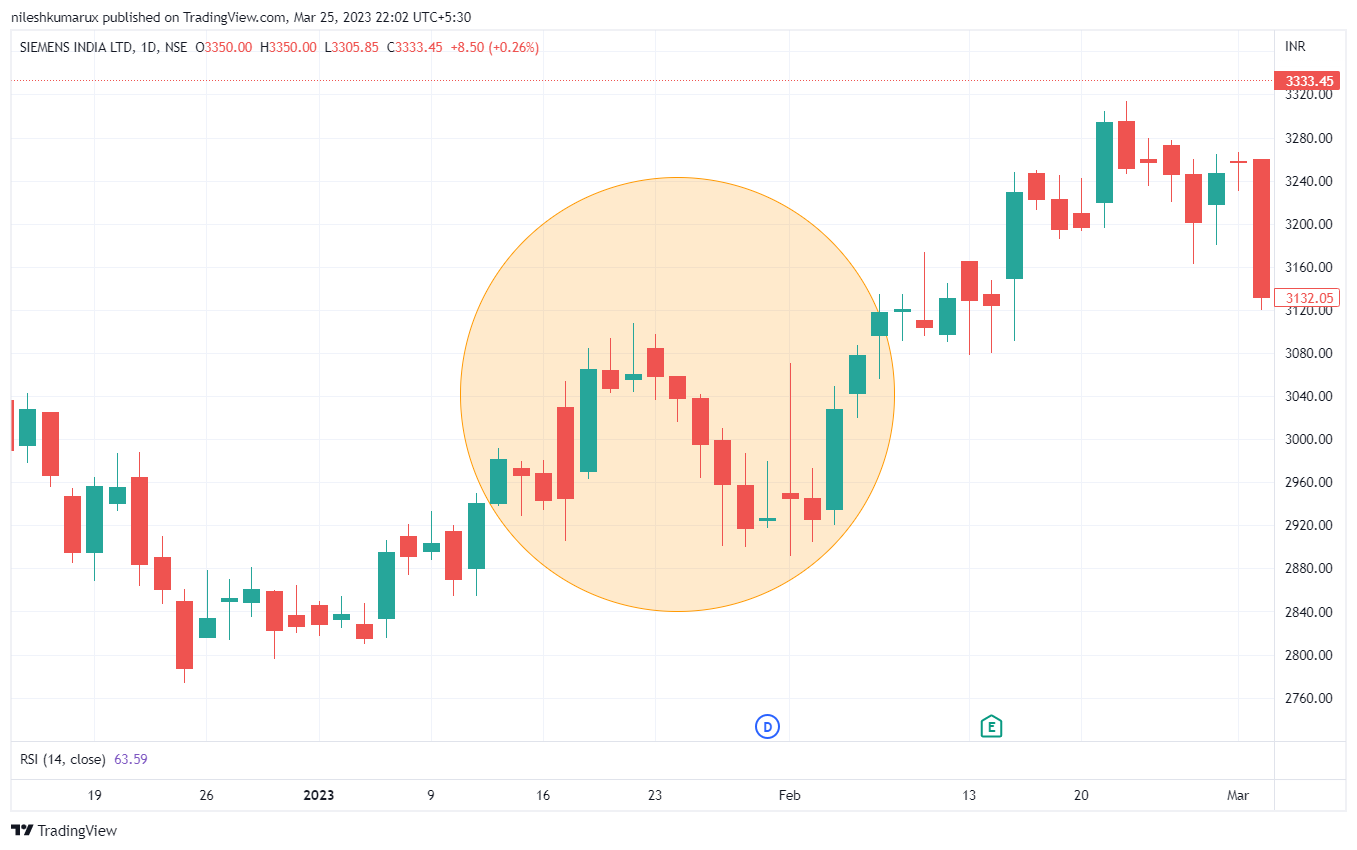
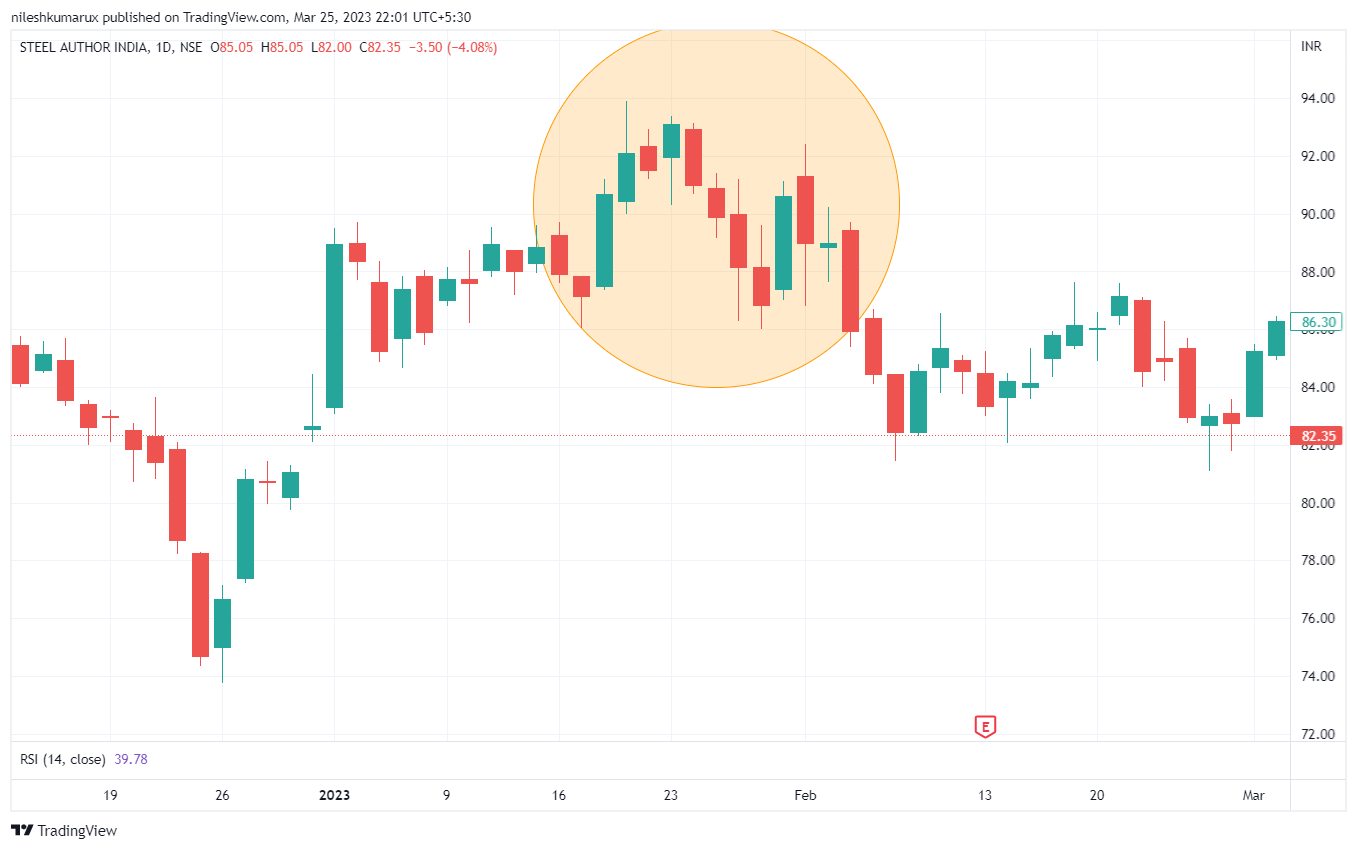
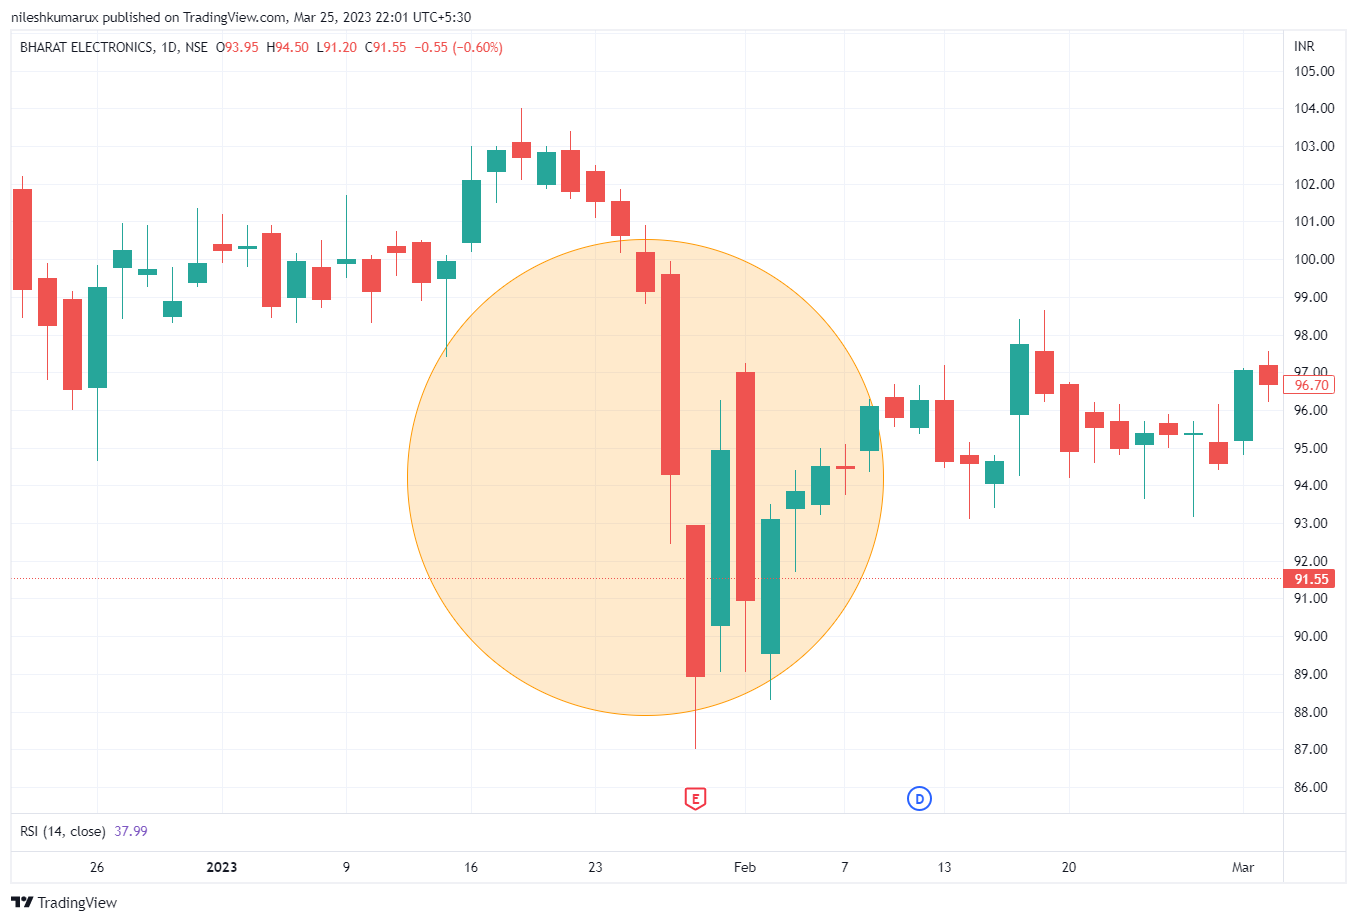
Before taking action on this, you have to check other technical indicators or price action patterns. For example, they may look for a bullish divergence in the relative strength index (RSI) or a break of a trendline.
Do comment if you have any doubts or suggestions on this Candlestick Pattern.
Disclaimer: All comapny chart are used only for learing purpose. There is no buy and sell recommandtion. All Technical analyst are learing purpose only.