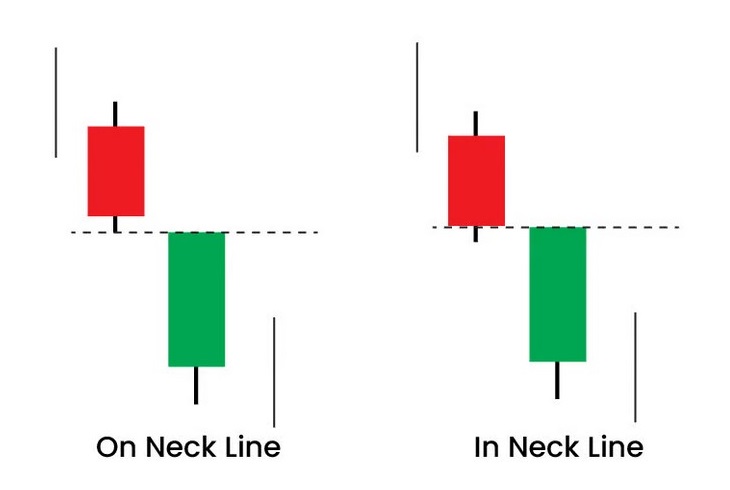
In neck Candlestick Patterns is a type of candlestick pattern that indicates a bearish continuation in a downtrend, suggesting that the downward trend is likely to persist. This pattern forms when a small white candlestick closes just below the low of the preceding long black candlestick.

It consists of a long black candlestick followed by a small white candlestick that closes below the low of the preceding black candlestick.
- The trend is negative
- The first candle is negative.
- The second candle opens below the close of the previous candle but closes at or slightly above the close of the previous candle.
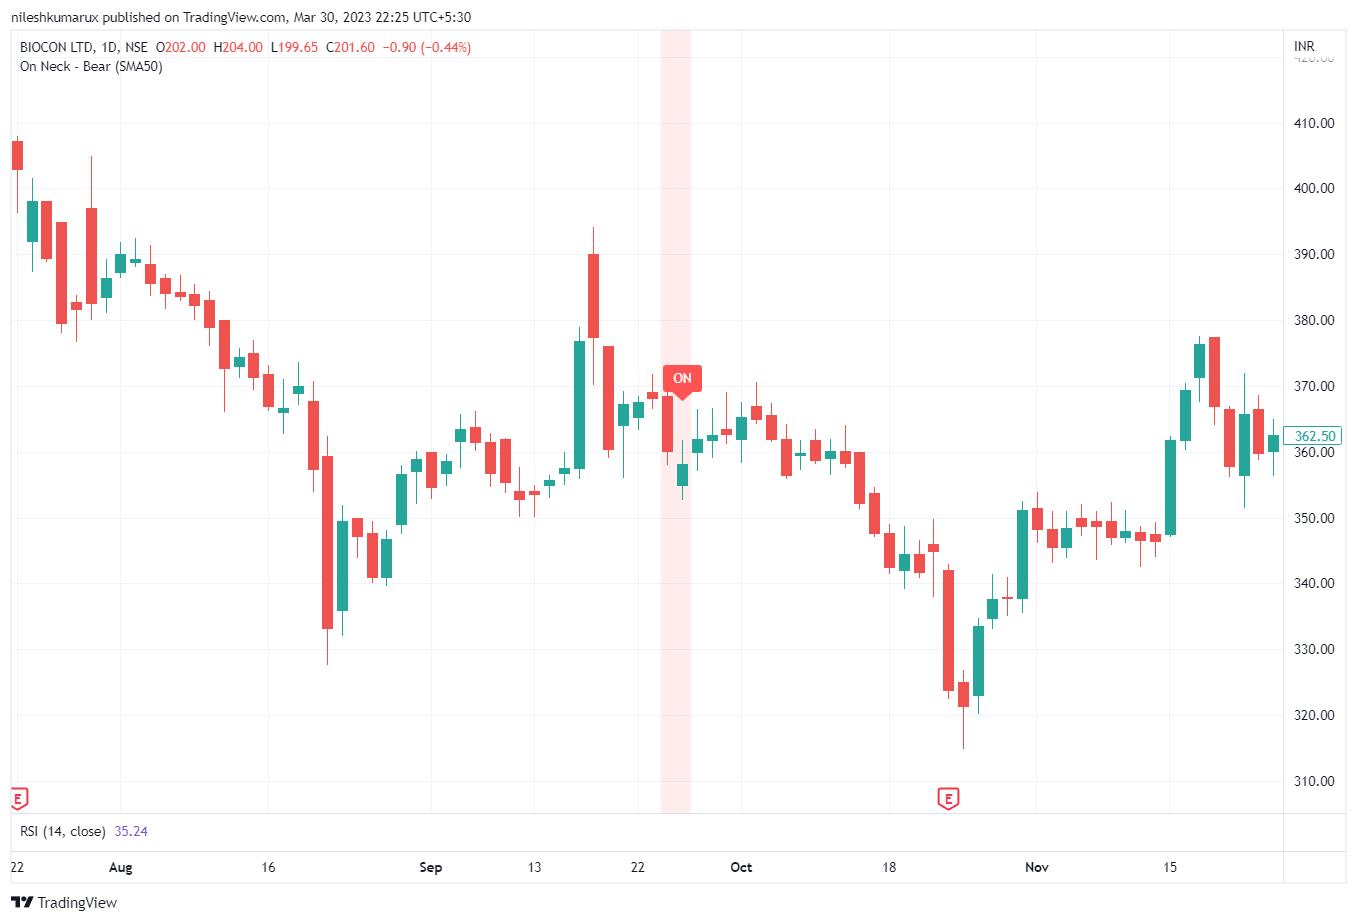
In neck Candlestick Patterns example
Let’s see some real charts with this pattern.

Difference Between On-neck and In-neck Candlestick Patterns
Answer: On-neck and in-neck candlestick patterns are two types of bearish continuation patterns that occur in technical analysis of financial markets.
The on-neck pattern occurs when a long black candlestick is followed by a smaller white candlestick that opens below the previous day’s low and closes at or very near the low of the black candlestick. This pattern suggests that the bears are still in control and that the downtrend is likely to continue.
The in-neck pattern is similar to the on-neck pattern, but the white candlestick in this pattern closes slightly below the low of the black candlestick. This pattern is considered to be slightly stronger than the on-neck pattern, as it shows a more decisive rejection of the previous day’s low.
In summary, the main difference between the on-neck and in-neck candlestick patterns is the closing price of the white candlestick relative to the low of the black candlestick. The in-neck pattern shows a stronger bearish continuation signal as the white candlestick closes below the low of the black candlestick.
Disclaimer: All comapny chart are used only for learing purpose. There is no buy and sell recommandtion. All Technical analyst are learing purpose only.