
Homing Pigeon Candlestick Pattern is a bullish reveal pattern that can appear at the bottom of a downtrend. It signals a potential reversal in price, as selling pressure weakens and buyers begin to step in.
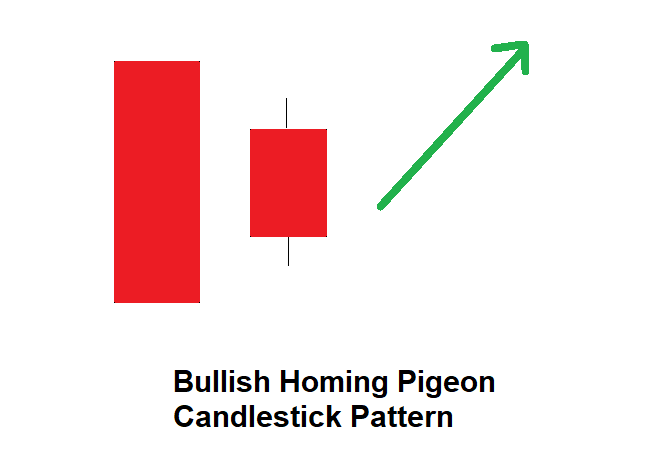
It is a two-candle pattern, where the first candle is a long bearish candlestick, followed by a shorter bullish candle that opens within the body of the first candle and closes above its midpoint.
Homing Pigeon Candlestick Pattern example
Here is a chart with this pattern.
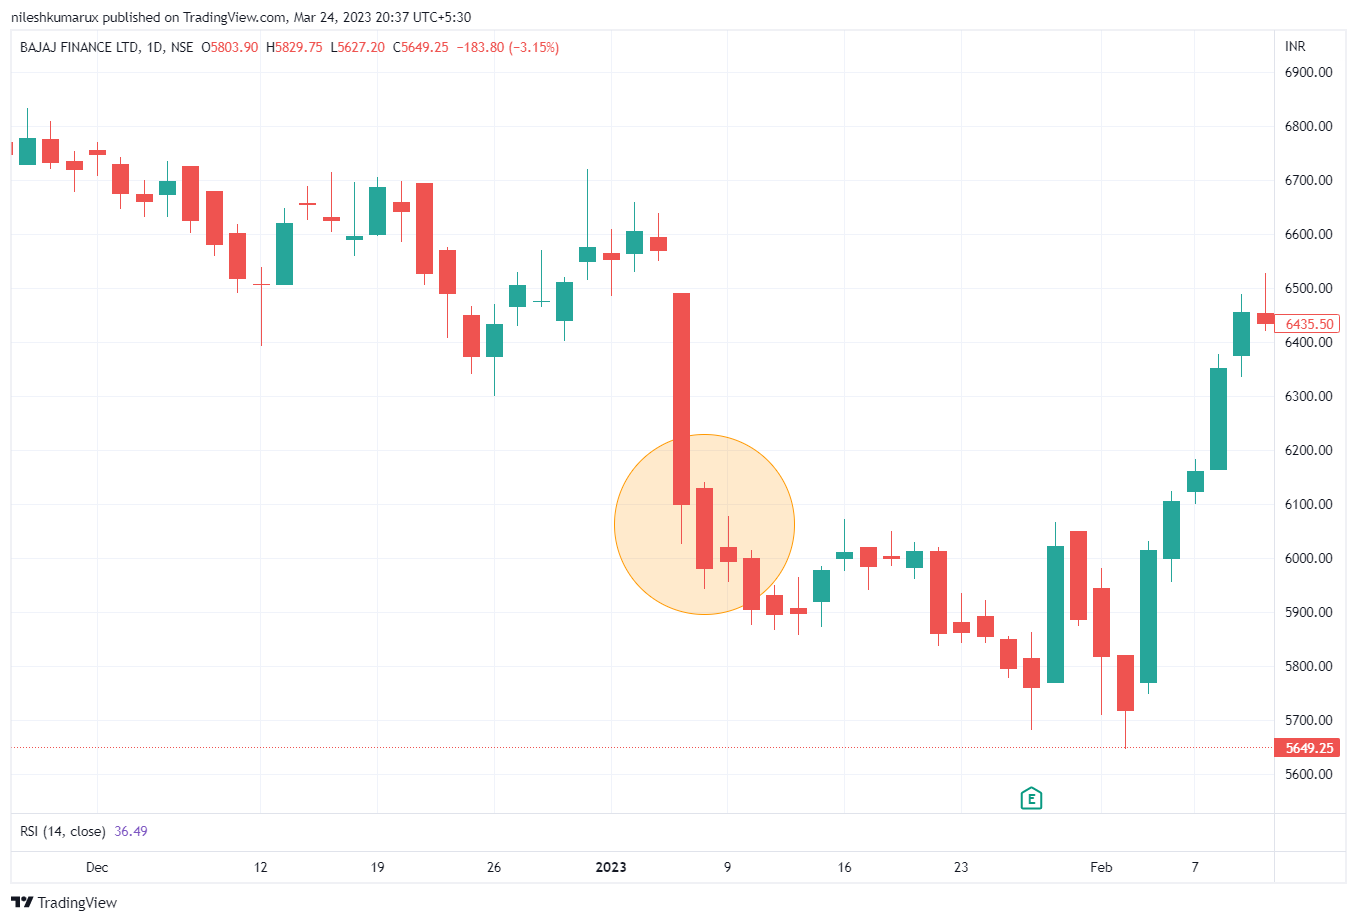
A more convincing indication of a reversal is when the second candle closes higher up on the first black candle.
Comment if you have any doubts or suggestions on this chart pattern topic.
Disclaimer: All comapny chart are used only for learing purpose. There is no buy and sell recommandtion. All Technical analyst are learing purpose only.