The engulfing candle is a candle that completely engulfs the previous day’s candle. The previous candle and current candle color should be different. The Engulfing Pattern is a major reversal pattern and is formed after a downtrend or uptrend.
There are 2 types of the engulfing candlestick.
- Bullish Engulfing Pattern
- Bearish Engulfing Pattern
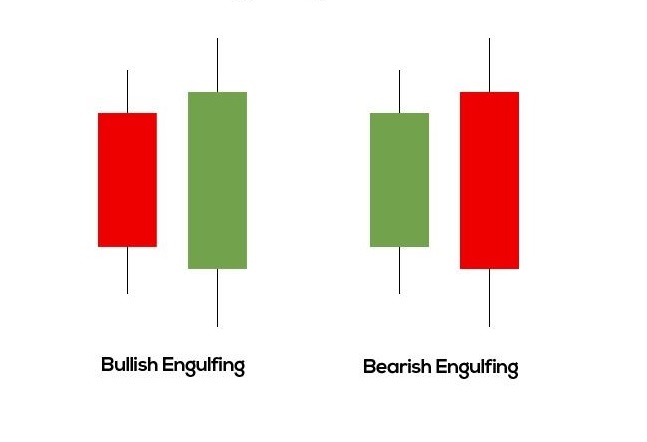
Bullish Engulfing Pattern
The Bullish Engulfing Pattern is formed after a downtrend. Price opens lower than the previous day’s close and closes higher than the previous day’s open. Thus, the Green candle completely engulfs the previous day’s Red candle.
How to identify a Bullish Engulfing candle
- A candle completely engulfs the body of the previous day’s candle.
- It should be a downtrend.
- The body of the second candle is the opposite color of the first candle.
Tip: Large volume on the engulfing day increases the chances that a blowoff day has occurred.
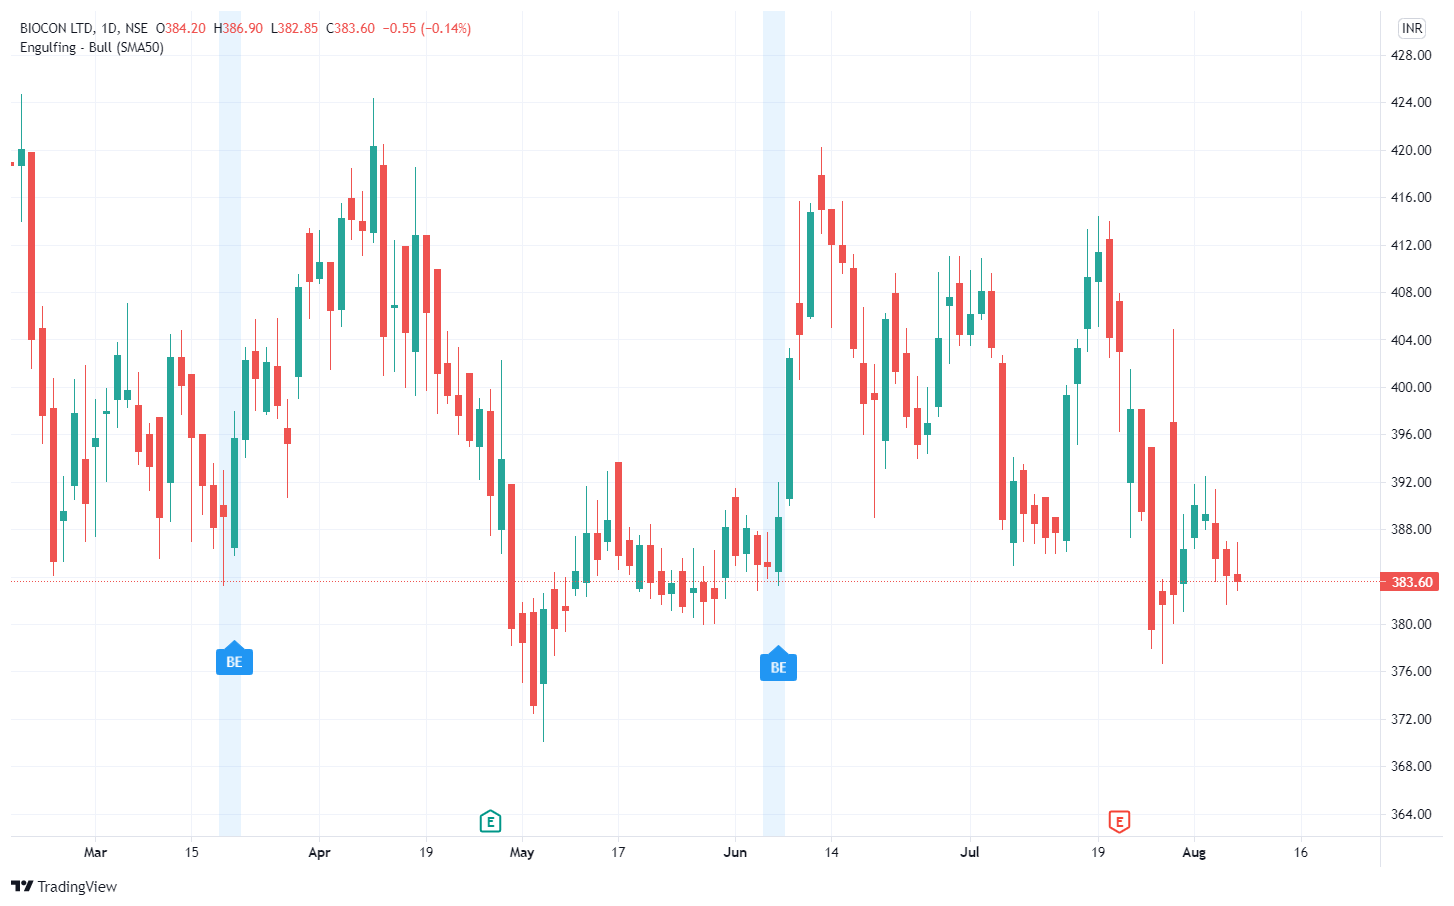
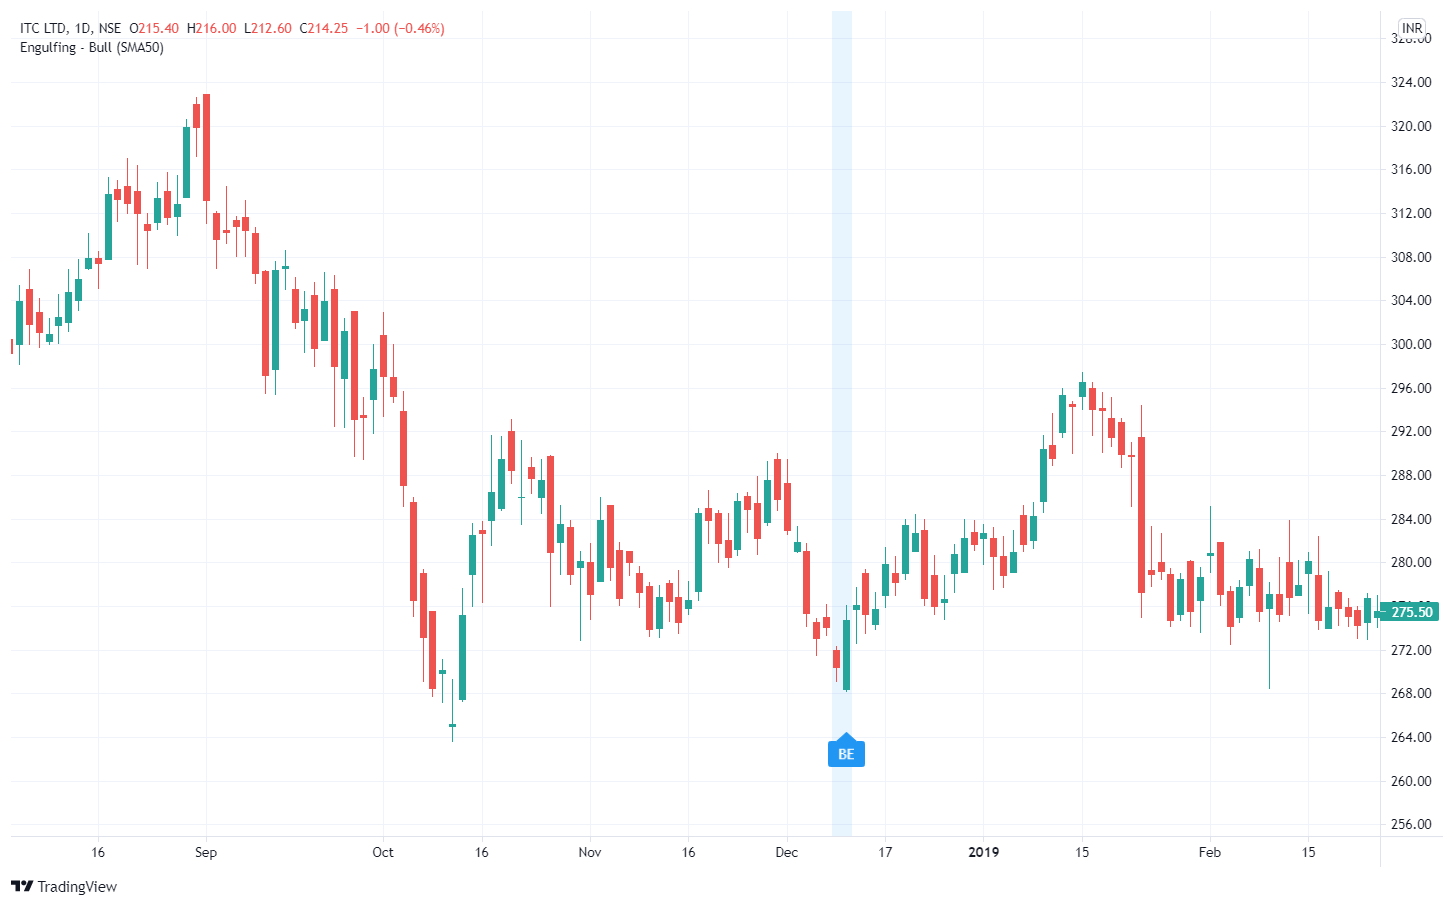
Bullish Engulfing Charts
Let’s see some real charts for this pattern.
Bearish Engulfing Pattern
The Bearish Engulfing Pattern is formed after an uptrend. It opens higher than the previous day’s close and closes lower than the previous day’s open. Thus, the Red candle completely engulfs the previous day’s green candle.
How to identify Bearish Engulfing candle
- The body of the second day completely engulfs the body of the first day.
- The stock trend should be uptrend.
- The candle’s body is the opposite color.
Bullish Engulfing Charts
Some examples of these patterns.
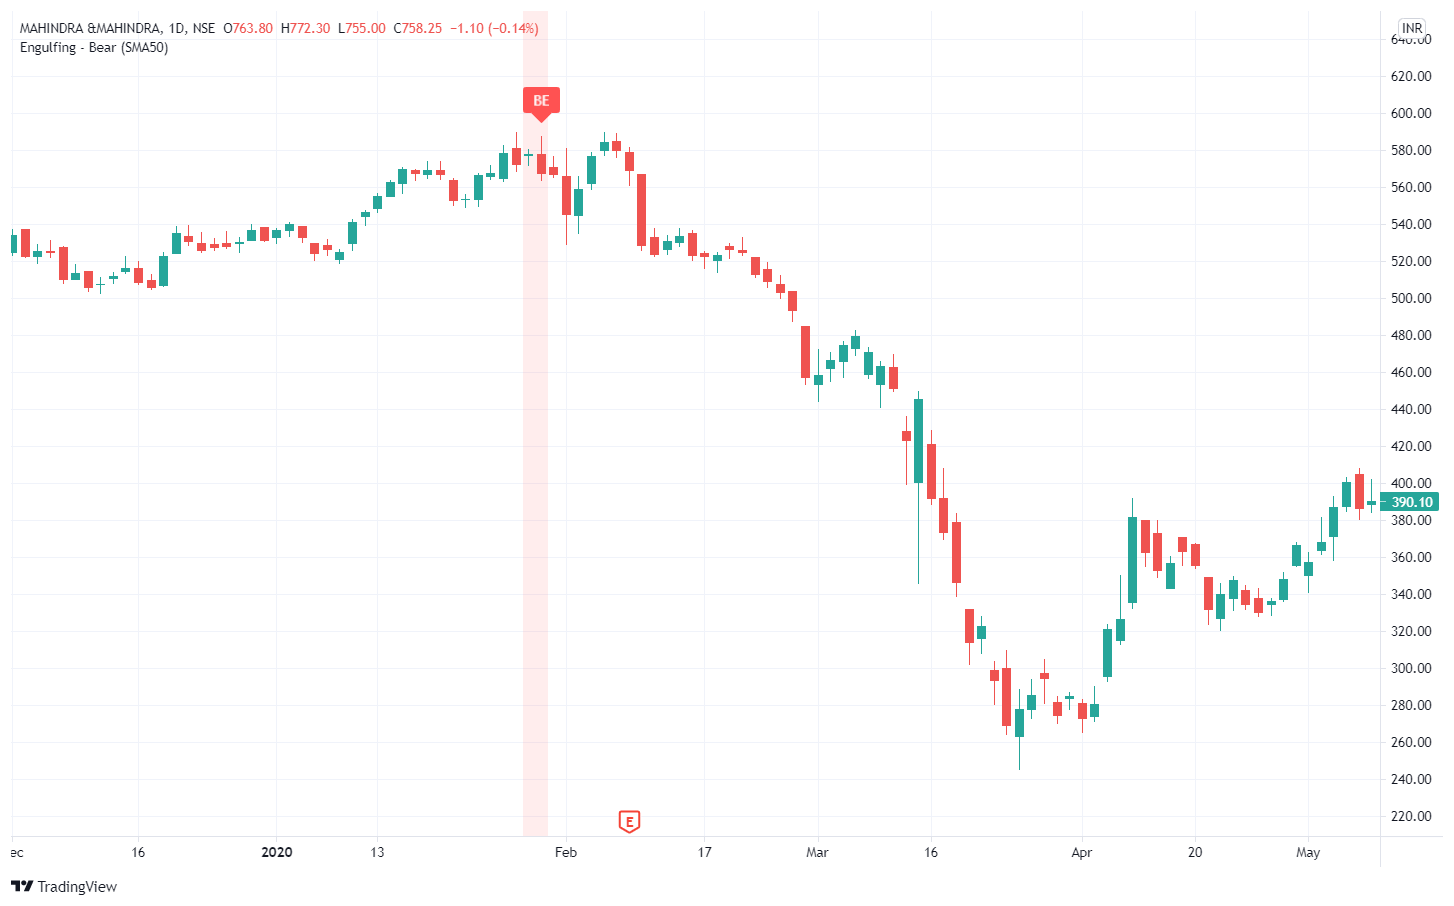
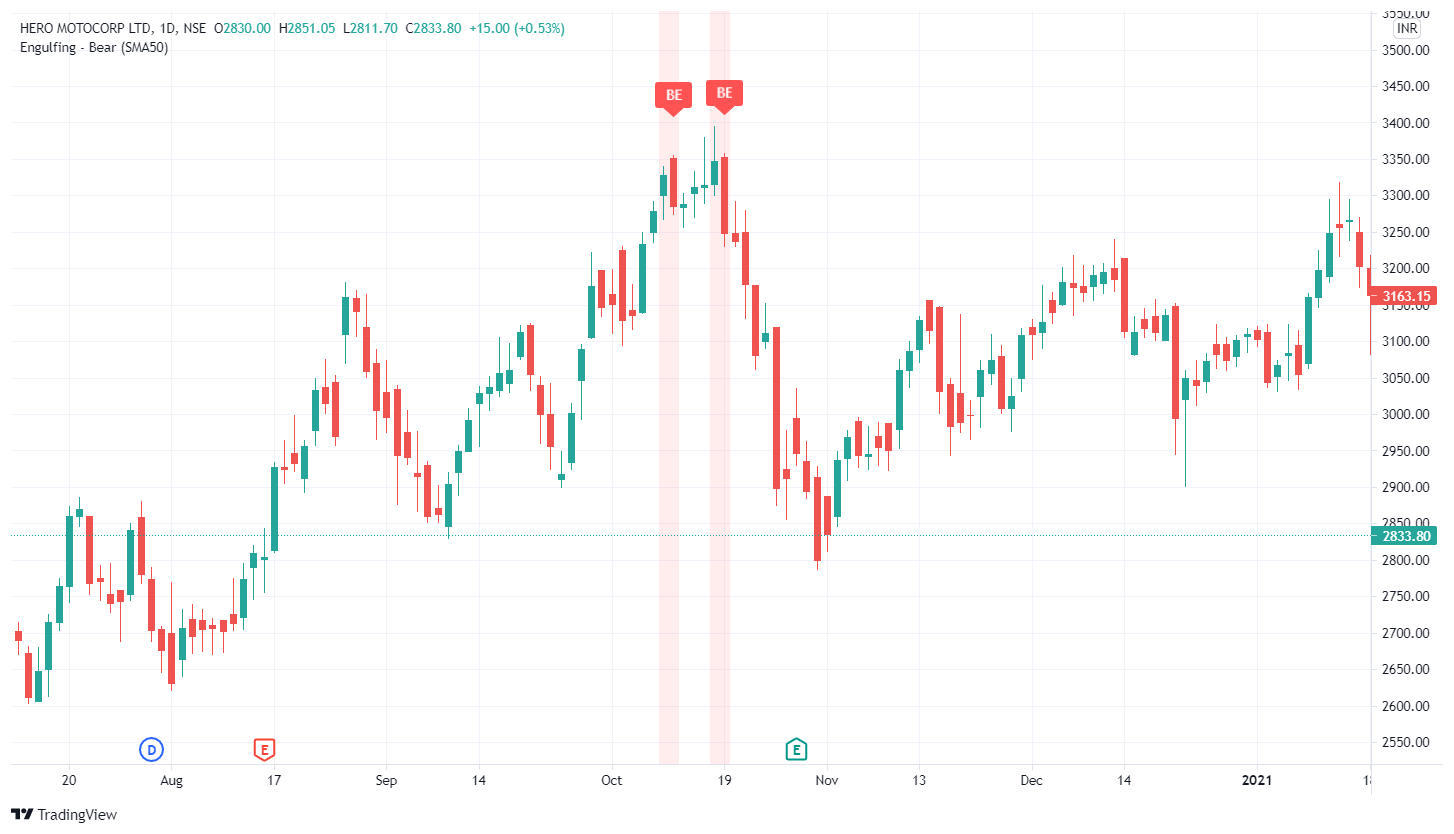
Note: Engulfing candles can engulf more than one previous body and it demonstrates power in the reversal.
Disclaimer: All comapny chart are used only for learing purpose. There is no buy and sell recommandtion. All Technical analyst are learing purpose only.