The Hanging Man is a bearish candlestick pattern commonly used in technical analysis to signal a potential trend reversal. It is formed when a small-bodied candlestick with a long lower shadow appears after an uptrend, indicating that sellers are beginning to outnumber buyers.
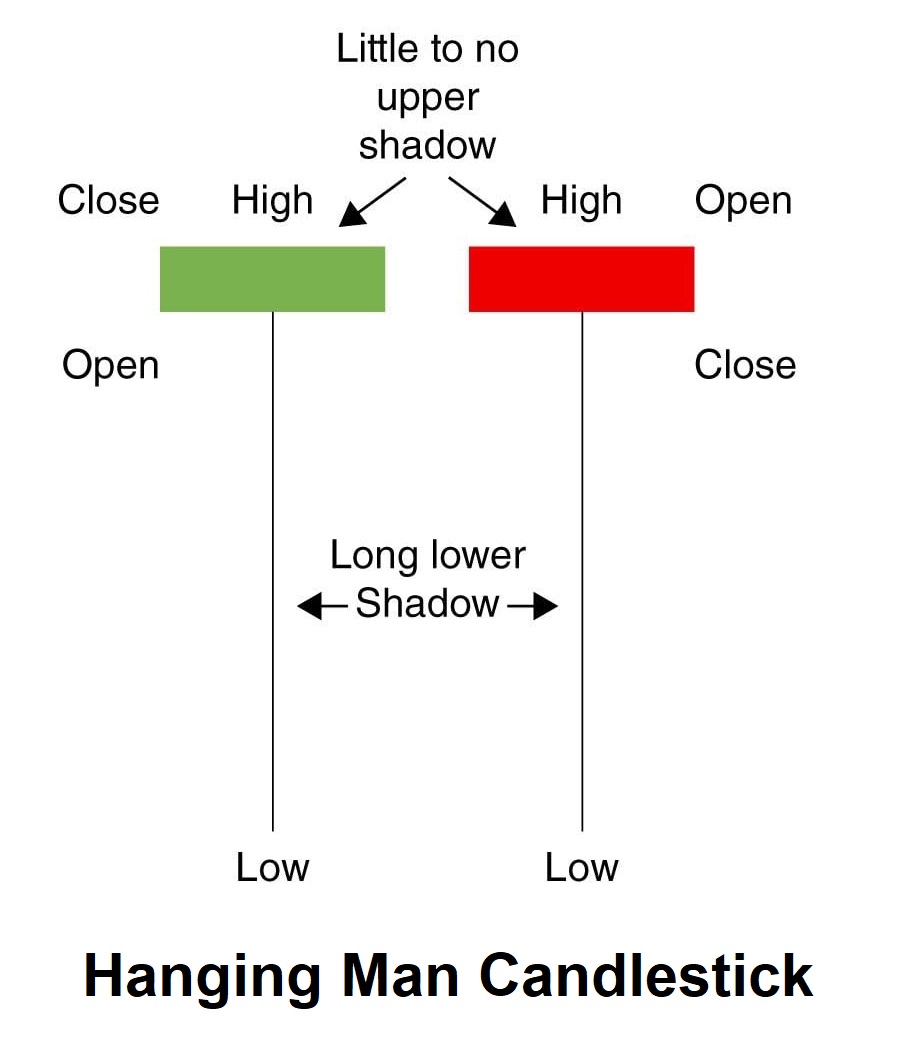
You can identify the Hanging Man pattern consists of the following characteristics:
- The candlestick has a small real body, typically red (it can be green), with a long lower shadow.
- The upper shadow is either nonexistent or very small.
- The real body is located at the lower end of the trading range.
- The pattern occurs after an uptrend, indicating a potential reversal in the trend.
- The longer the lower shadow, the more significant the pattern is considered.
The Hammers, Hanging Man, and Shooting Star have long shadows that make them stand out
Hanging Man Candlestick Pattern example
let’s see some charts for this pattern.
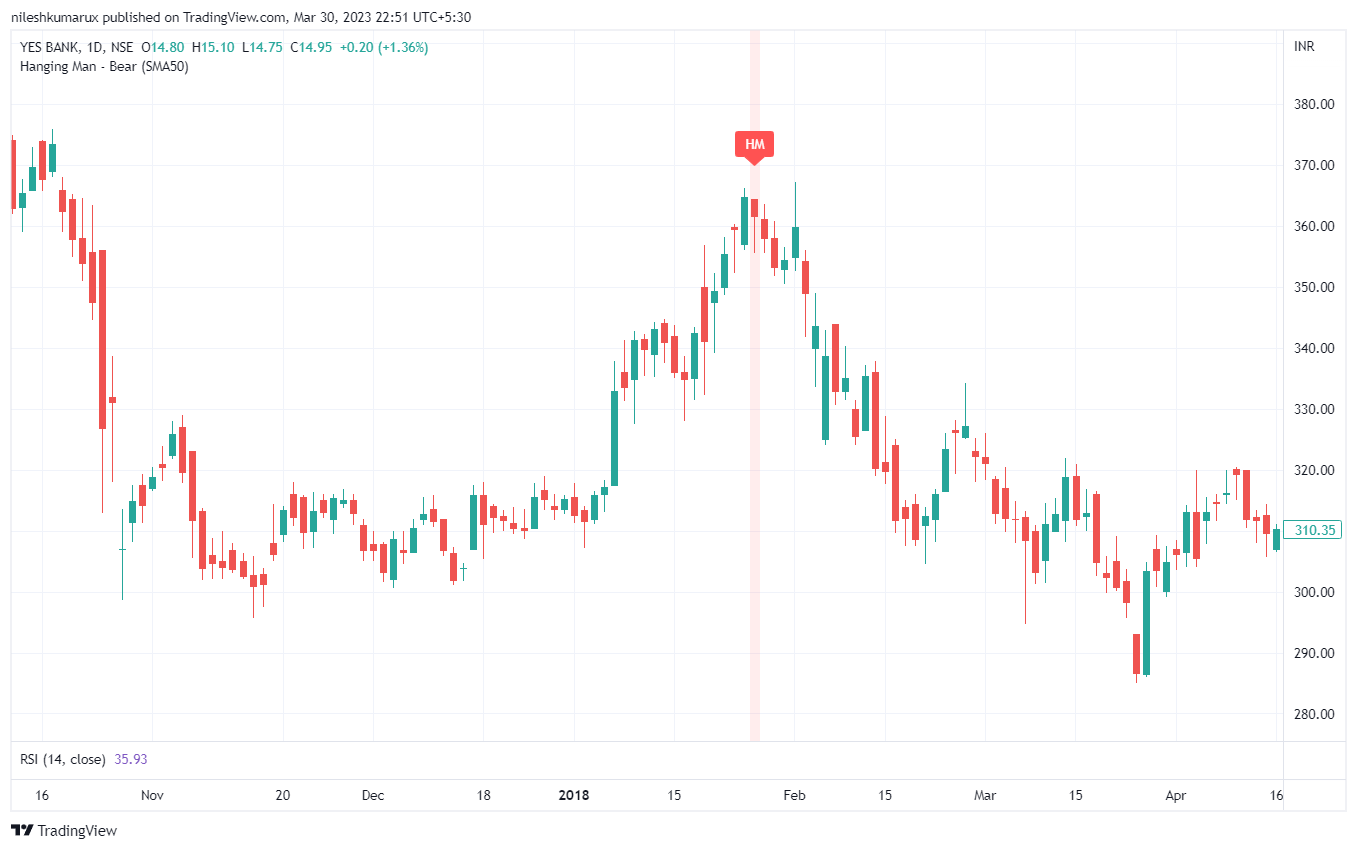
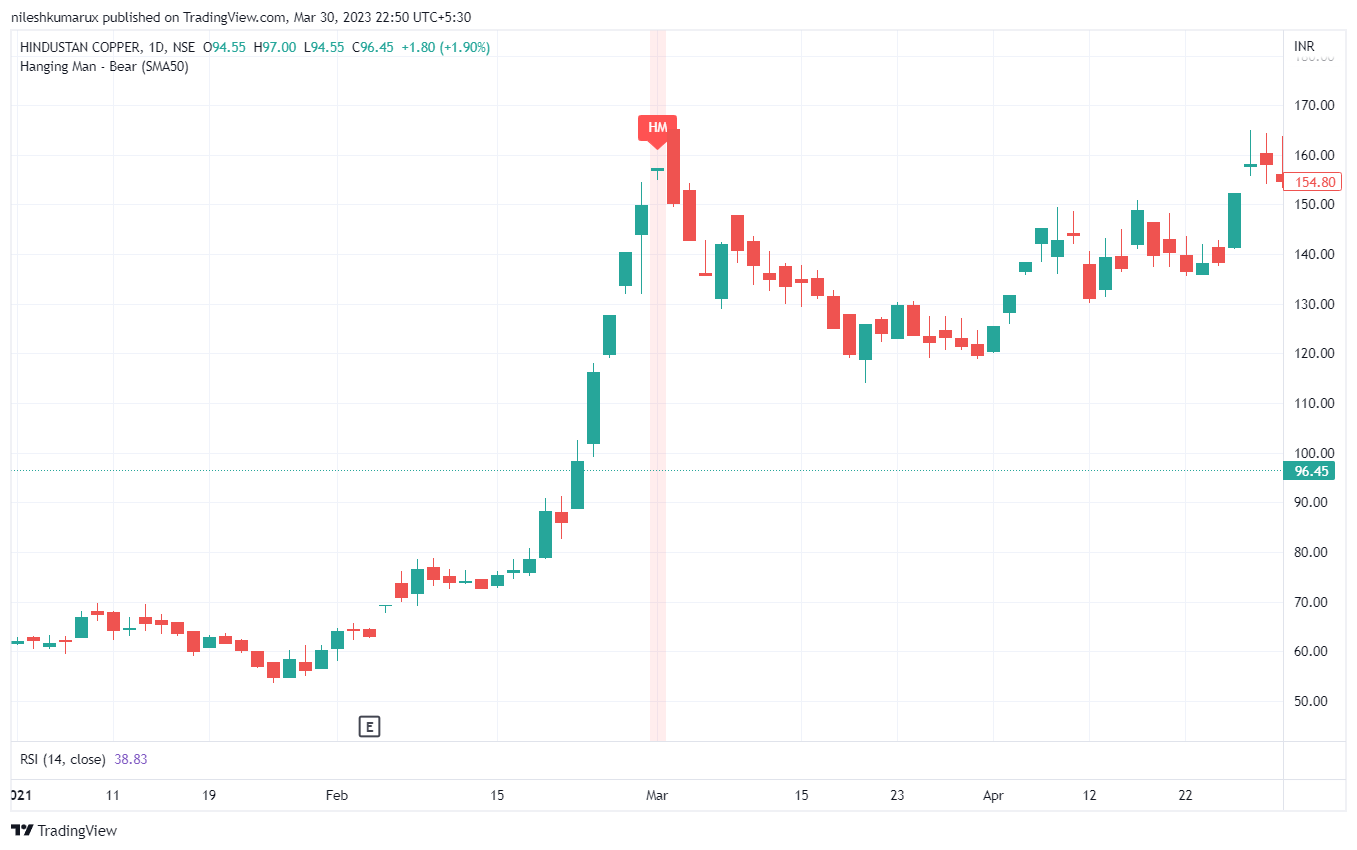
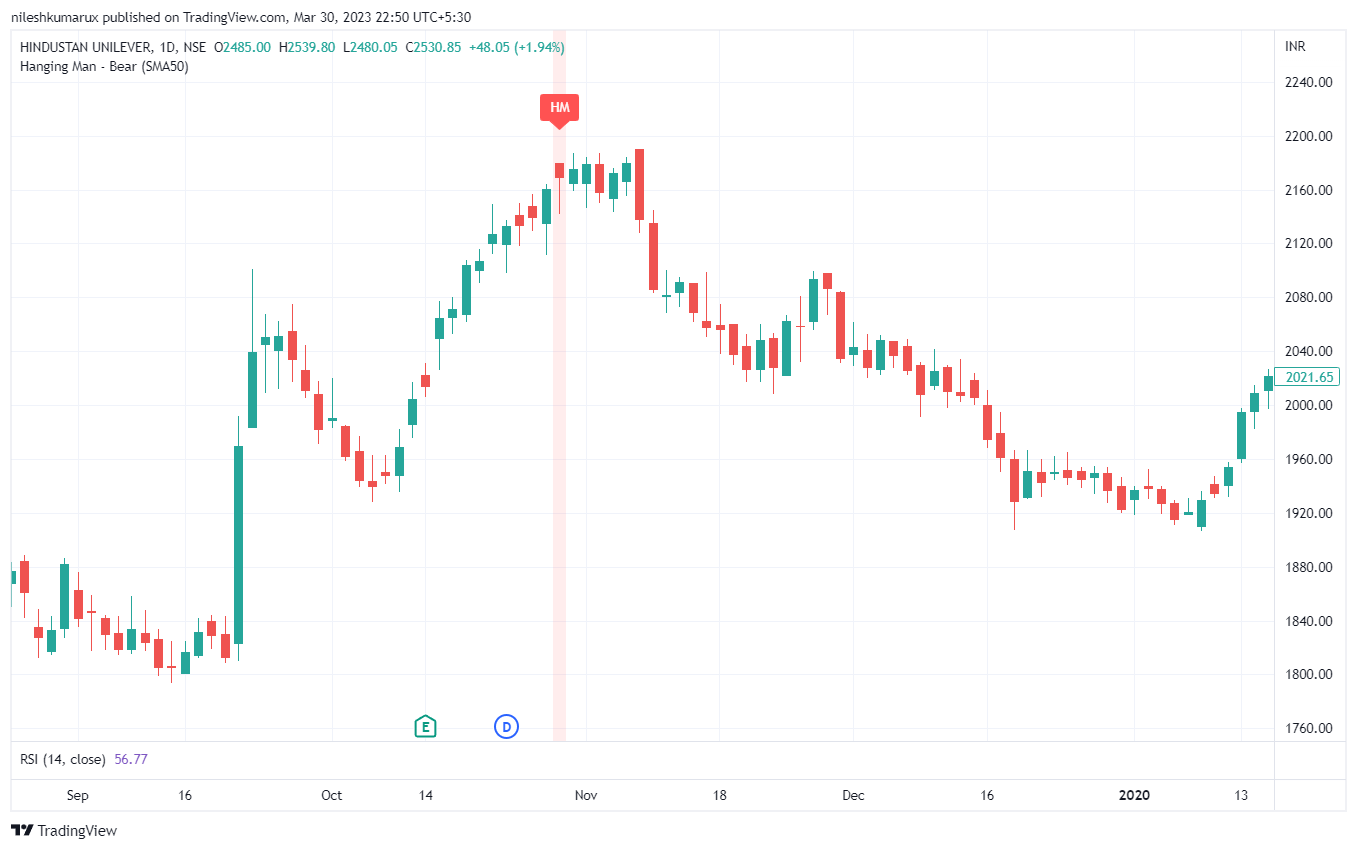
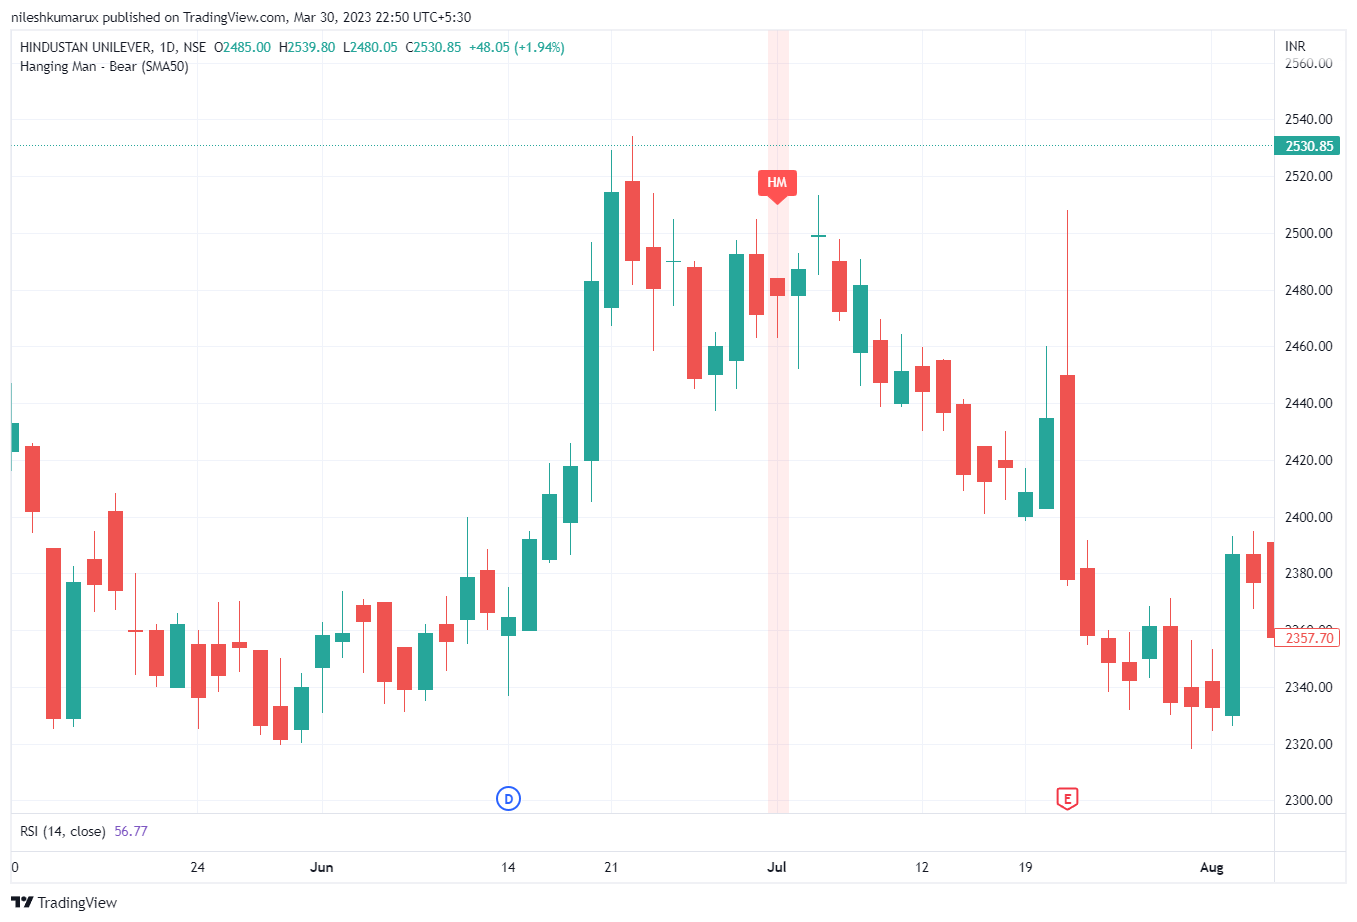
The Hanging Man pattern suggests that buyers are losing control and that the trend may be about to reverse. Traders often look for confirmation of the pattern before making trading decisions, such as waiting for the next candle to close lower or for a bearish indicator to appear.
Disclaimer: All comapny chart are used only for learing purpose. There is no buy and sell recommandtion. All Technical analyst are learing purpose only.