
There are many types of trendlines in Technical Analysis. Trendlines are used to predict possible future trends based on the know values of the past. Some of the most common types include:
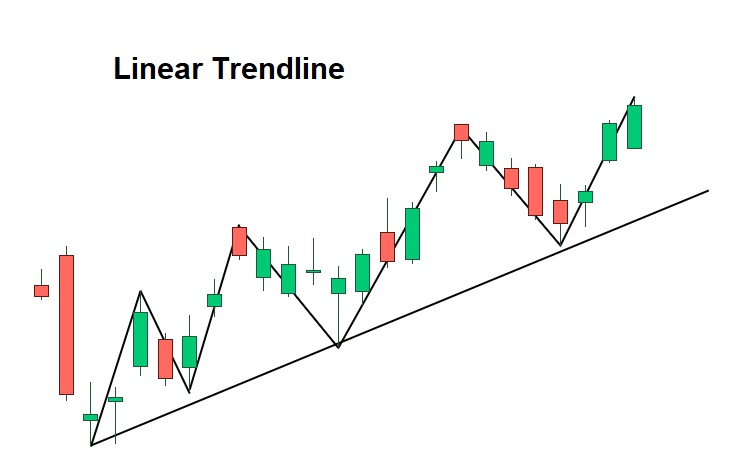
- Linear Trendline: A linear trendline is a straight line that is drawn through a series of data points. It is used to identify the overall trend of the data and to make predictions about future price movements.
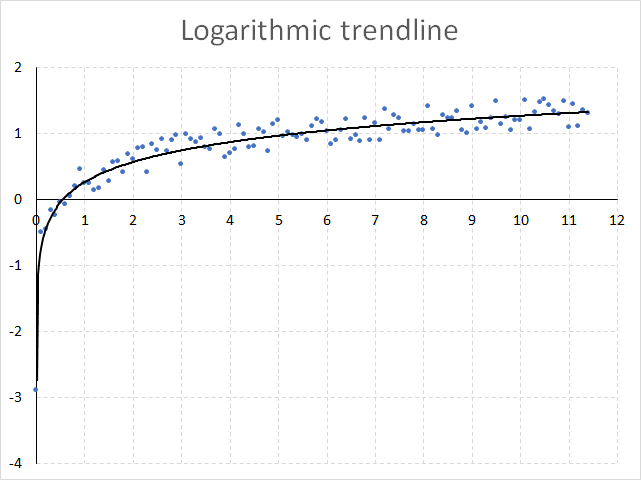
- Logarithmic Trendline: A logarithmic trendline is used when the rate of change in the data is not constant over time. It is often used to analyze data that exhibit exponential growth or decay.
- Exponential Trendline: An exponential trendline is used to analyze data that exhibits a constant rate of change over time. It is often used to identify trends in data related to population growth or the adoption of new technologies.
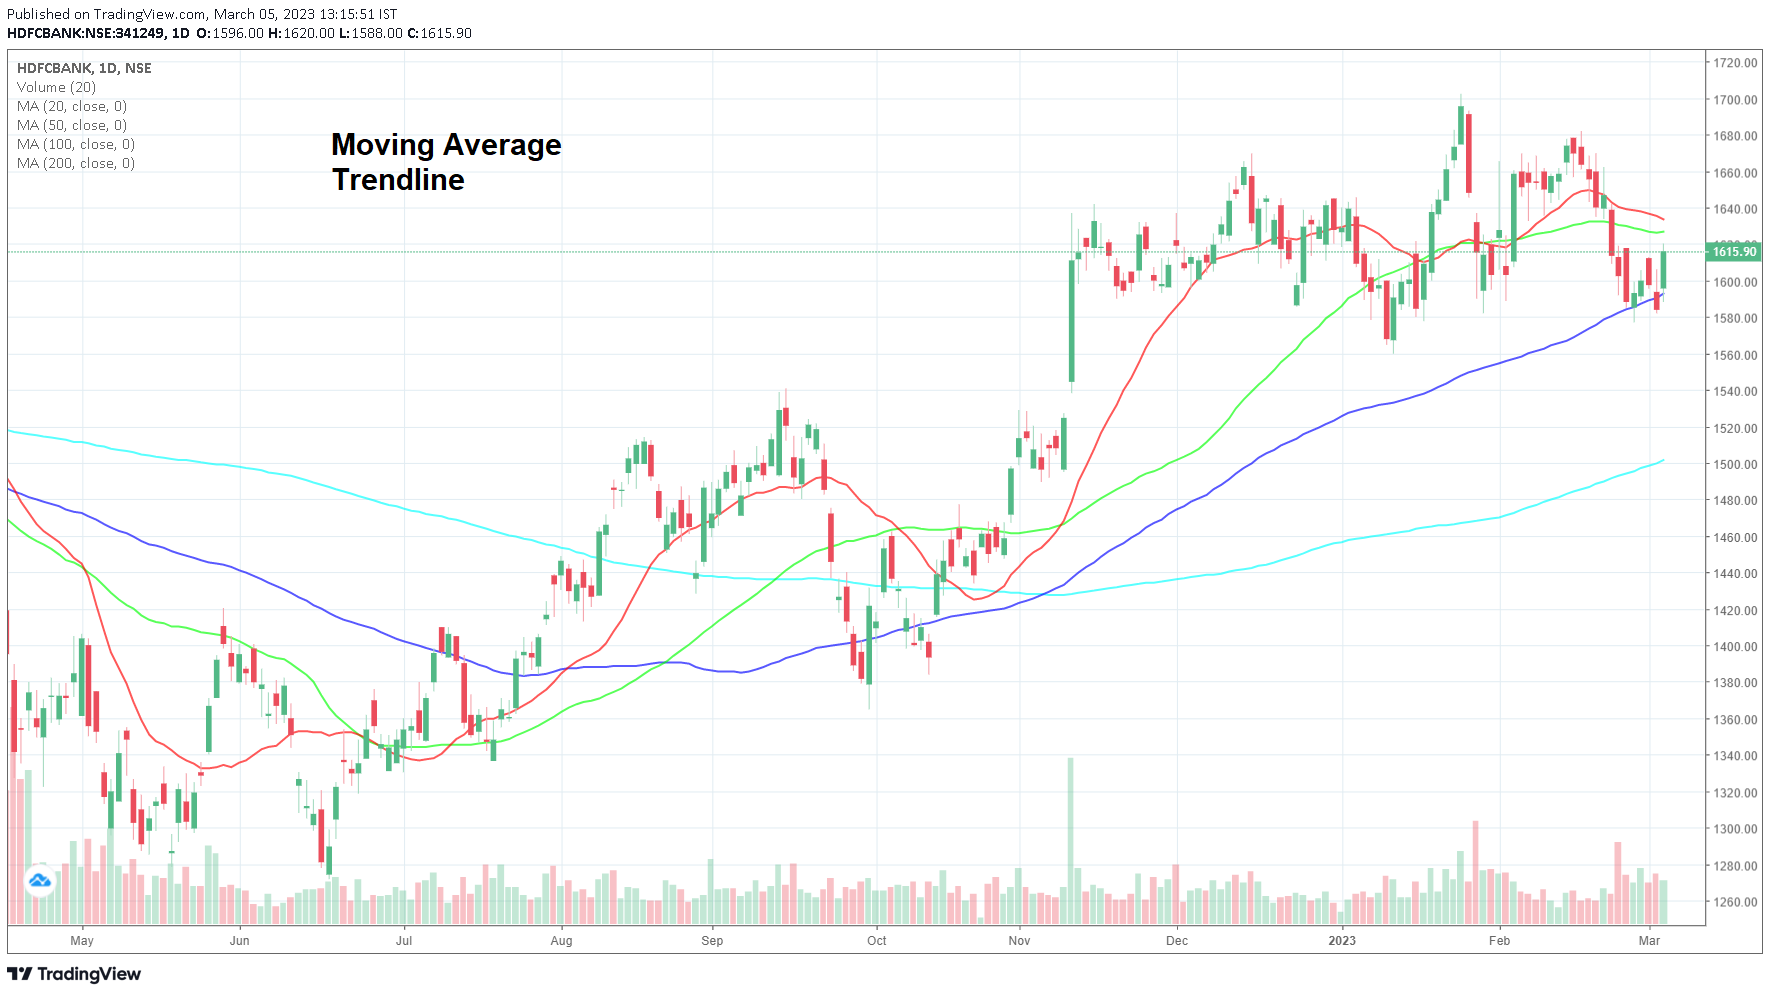
- Moving Average Trendline: A moving average trendline is calculated by averaging a set number of data points over a specific time period. It is used to smooth out short-term fluctuations in the data and to identify longer-term trends.
- Polynomial Trendline: A polynomial trendline is used to analyze data that exhibits a non-linear relationship between the variables. It is often used to analyze data related to scientific research or engineering projects.
Example of trendlines in technical analysis
Traders often use a combination of different trendline types and other technical indicators to make informed trading decisions.
Disclaimer: All comapny chart are used only for learing purpose. There is no buy and sell recommandtion. All Technical analyst are learing purpose only.