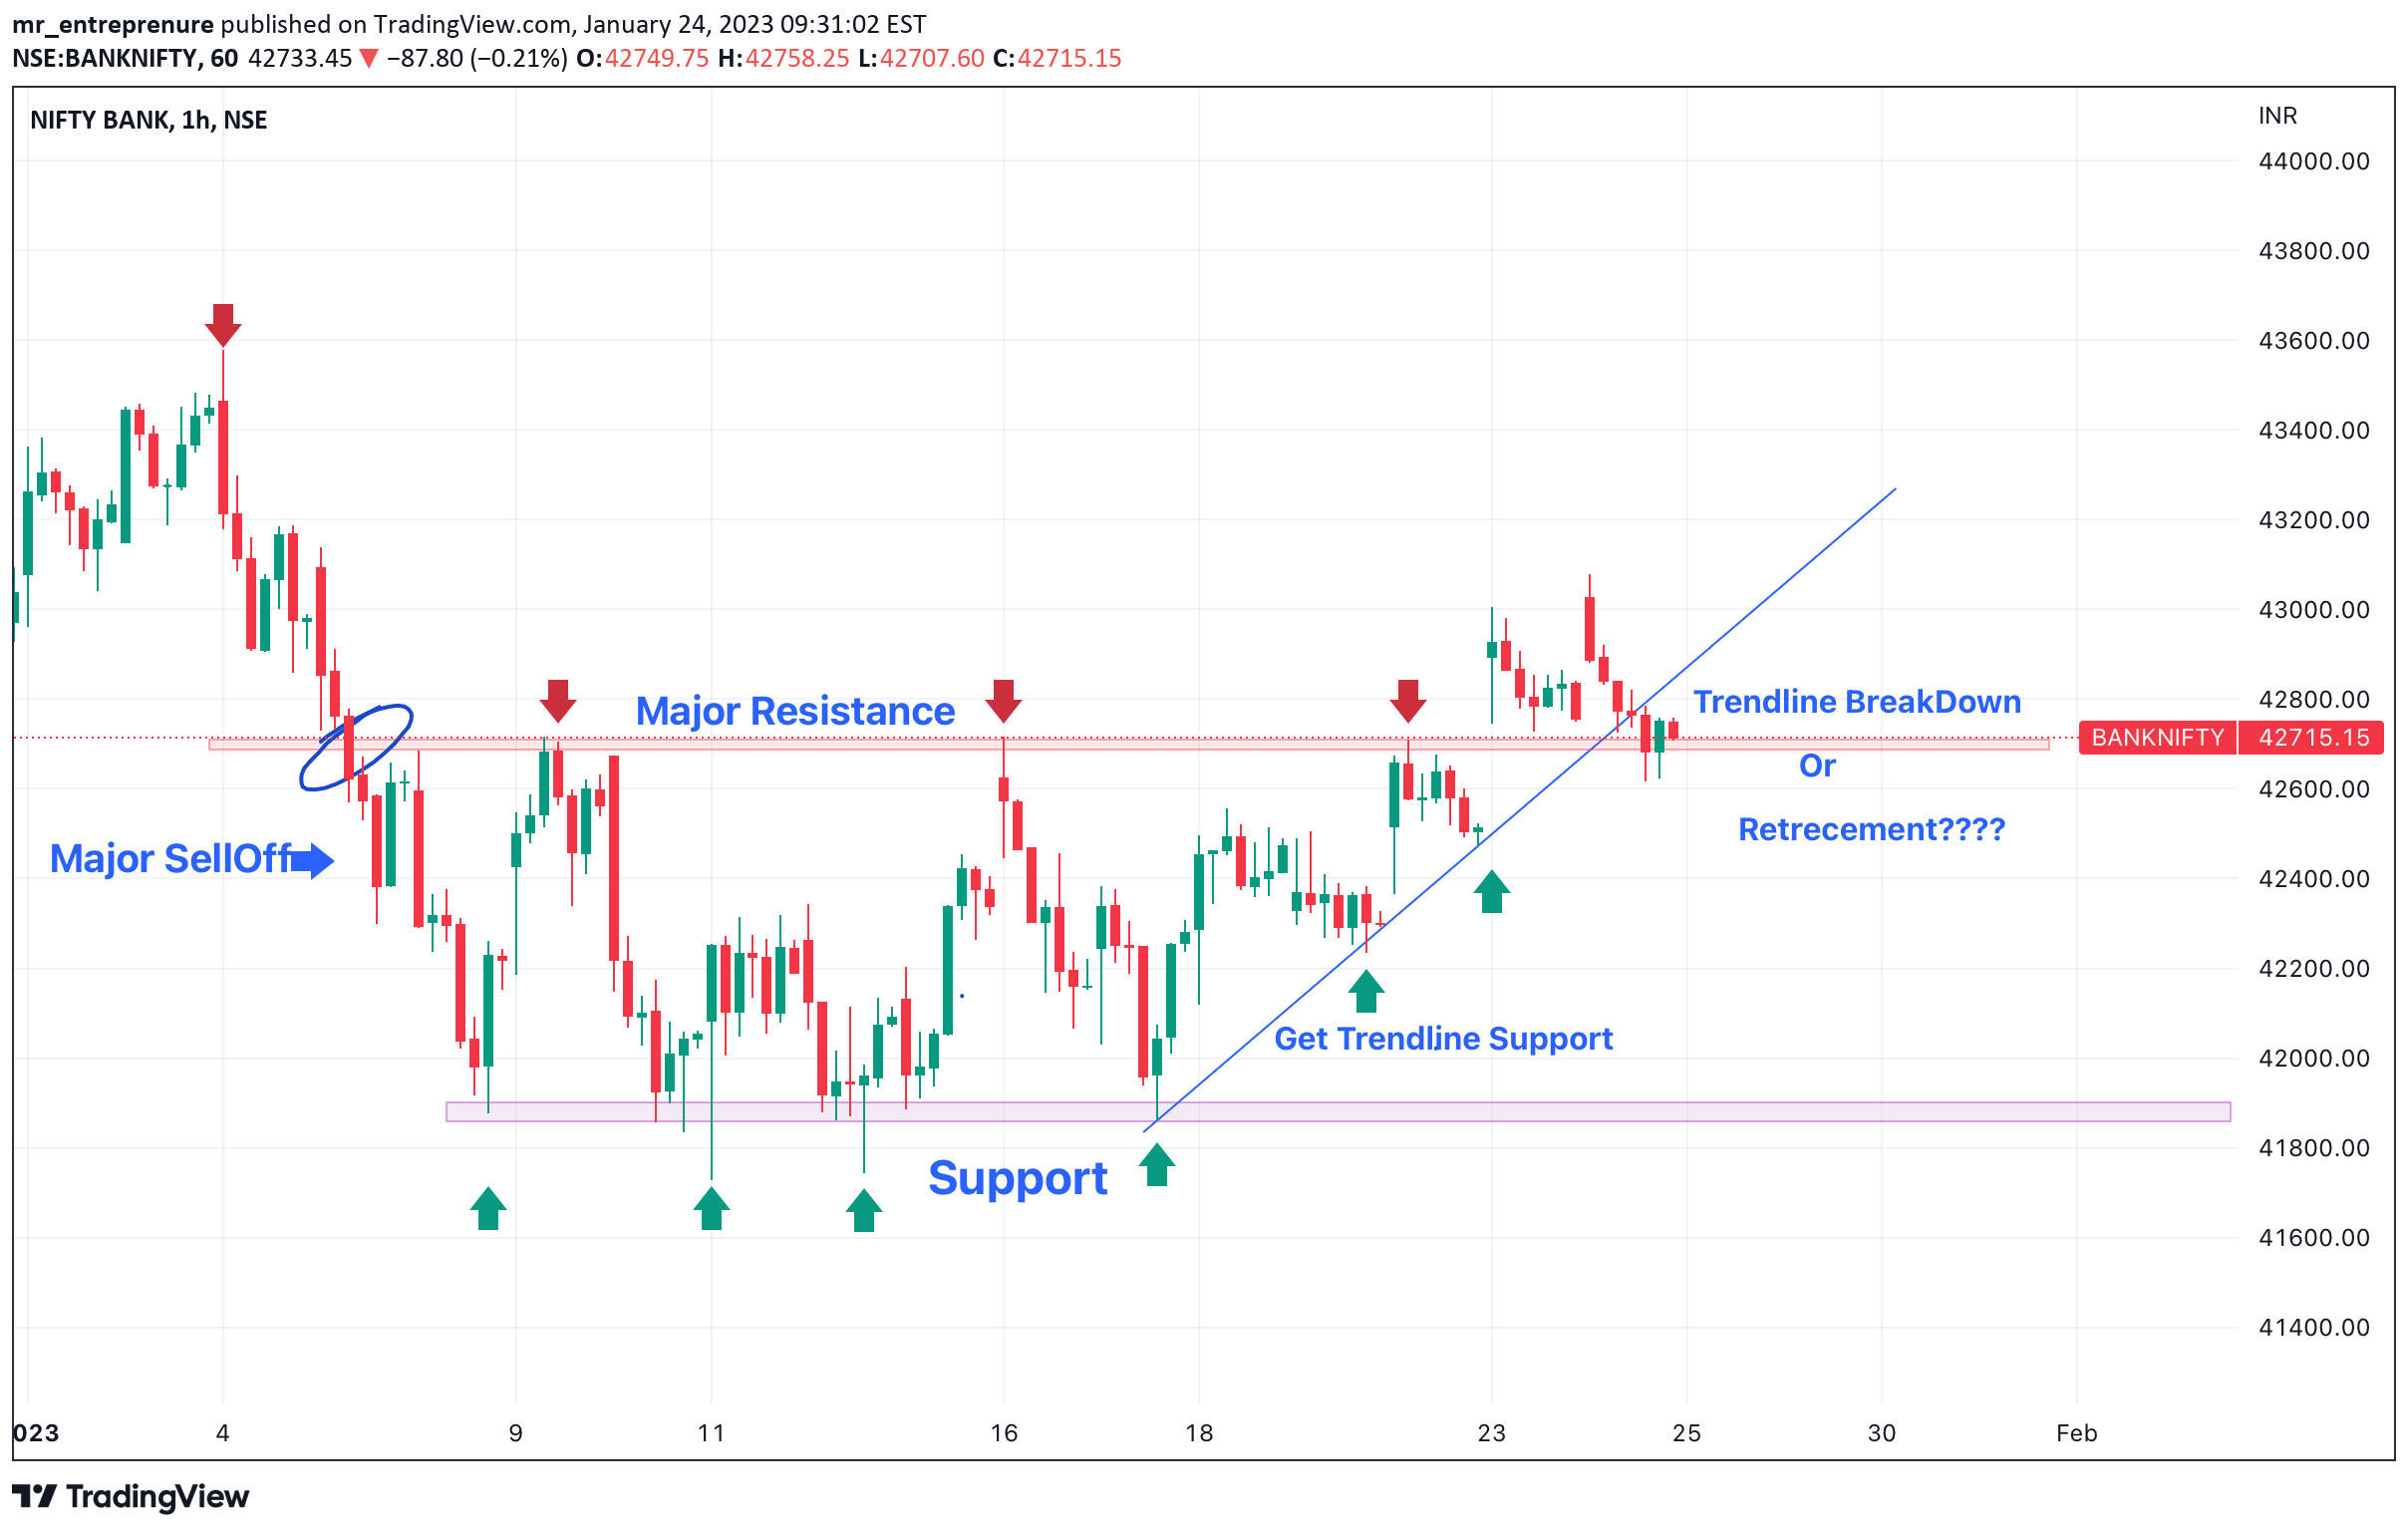
Rectangle Chart Pattern Formation is a technical analysis pattern that occurs when the price of a stock is bounded by two parallel trendlines. The top trendline represents the resistance level, while the bottom trendline represents the support level.
The stock price moves within this range, it creates a rectangular shape on the chart.
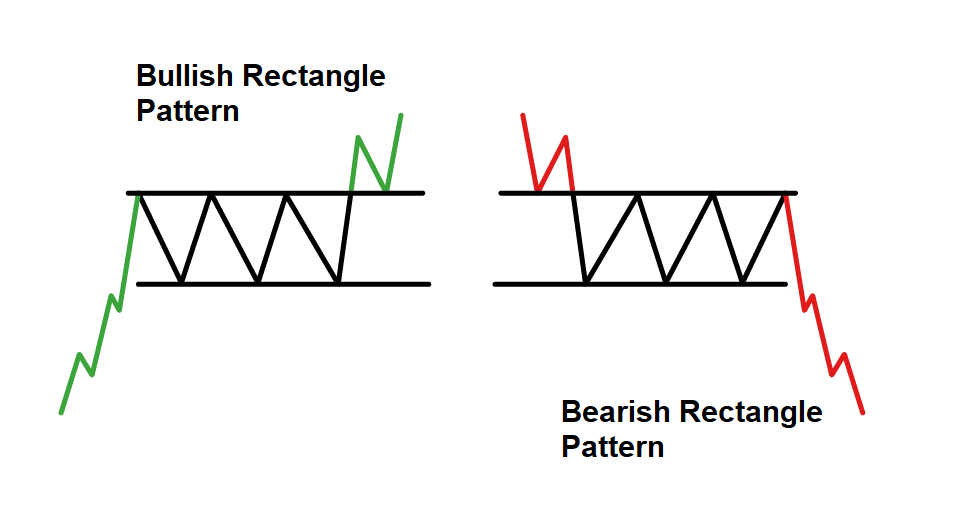
There are two main types of rectangle chart patterns: continuation patterns and reversal patterns.
- Continuation patterns: These patterns occur during a trend and indicate that the trend is likely to continue after a brief pause. The two main types of continuation patterns are:
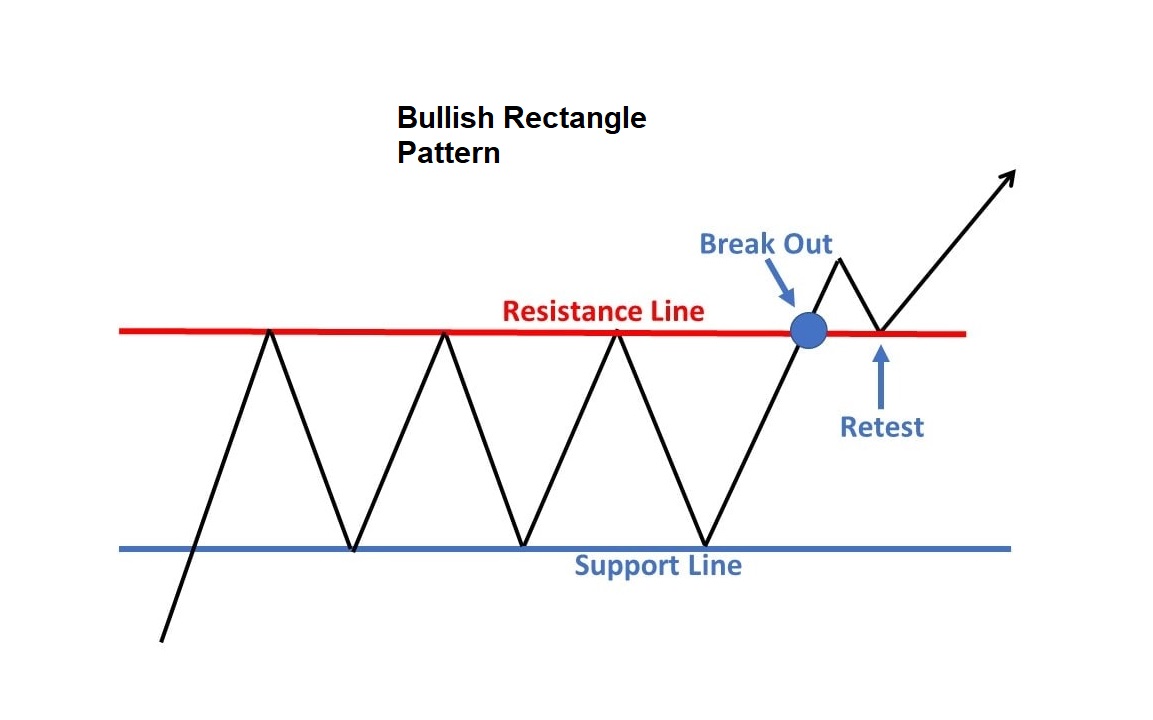
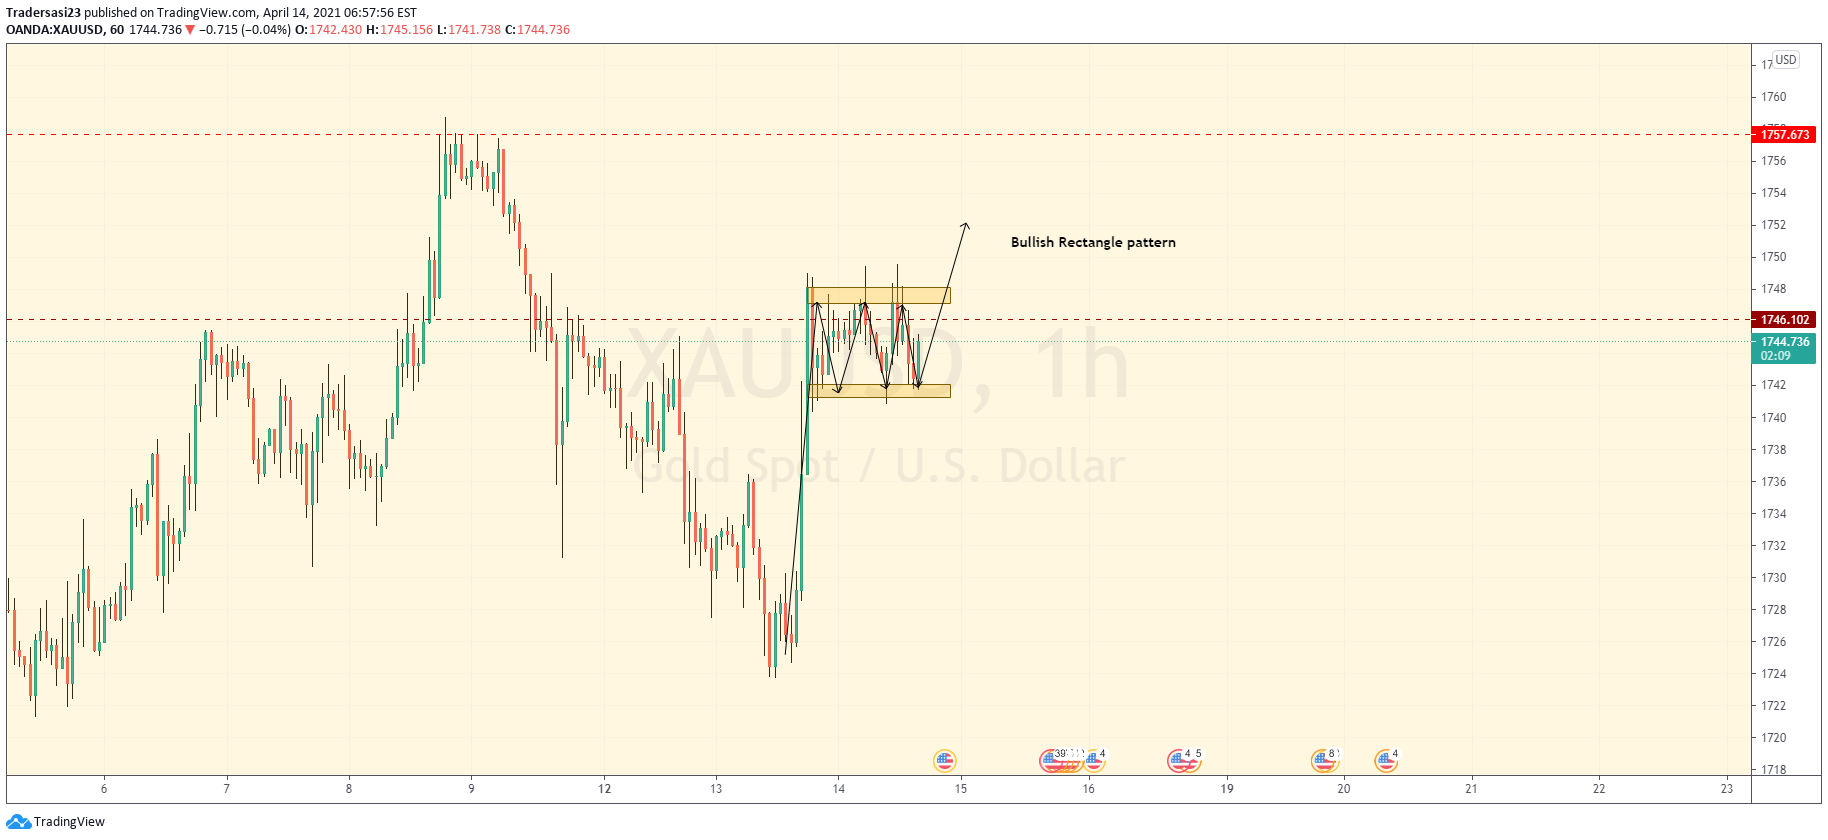
- Bullish rectangle: This pattern occurs when the stock price is in an uptrend and forms a rectangle between a support level and a resistance level. The pattern indicates that the price is likely to continue its uptrend after a brief consolidation period.
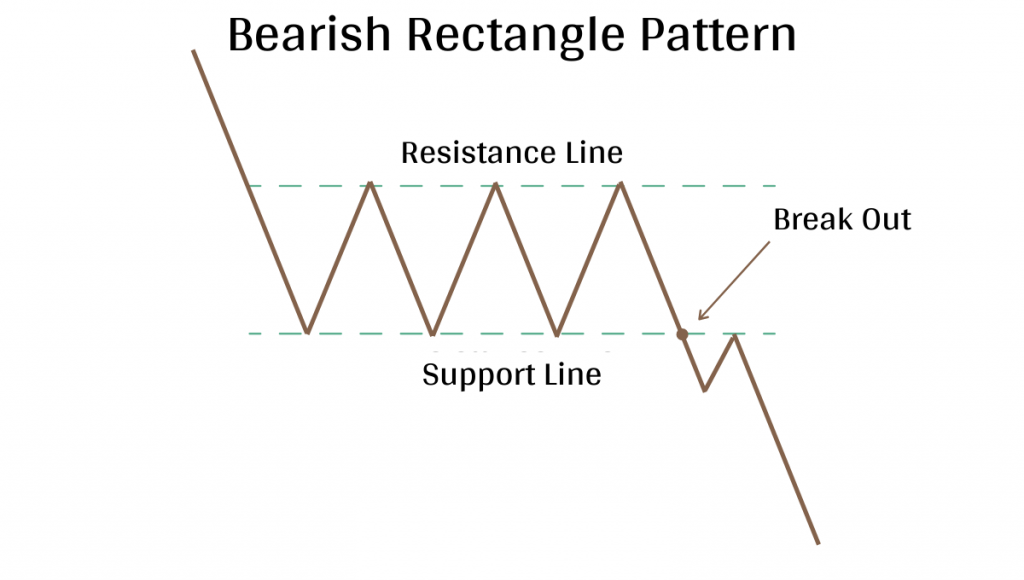
- Bearish rectangle: This pattern occurs when the stock price is in a downtrend and forms a rectangle between a support level and a resistance level. The pattern indicates that the price is likely to continue its downtrend after a brief consolidation period.
- Reversal patterns: These patterns occur when the price is in a trend and indicate that the trend is likely to reverse after a brief consolidation period. The two main types of reversal patterns are:
- Bullish breakout: This pattern occurs when the price is in a downtrend and forms a rectangle between a support level and a resistance level. The pattern indicates that the price is likely to break out to the upside, indicating a potential trend reversal.
- Bearish breakout: This pattern occurs when the price is in an uptrend and forms a rectangle between a support level and a resistance level. The pattern indicates that the price is likely to break out to the downside, indicating a potential trend reversal.
How to identify Rectangle Chart Pattern
To identify or draw a rectangle chart pattern, you have to look for a price chart that shows a series of peaks and troughs that are roughly parallel to each other. And Draw horizontal trend lines that connect the peaks and troughs to form the upper and lower boundaries of the rectangle.
Note: Look for at least two touches of the upper trendline and two touches of the lower trendline to confirm the rectangle pattern. The more touches, the stronger the pattern.
Bullish Rectangle Chart Pattern Trade Example
Here are some latest examples of Rectangle Chart Patterns in the Stock market.
Disclaimer: All comapny chart are used only for learing purpose. There is no buy and sell recommandtion. All Technical analyst are learing purpose only.
