
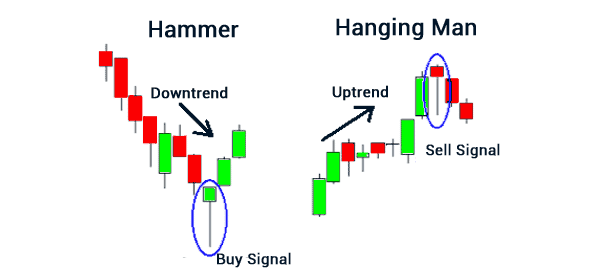
A hanging man candlestick pattern is a bearish reversal pattern that occurs during an uptrend. It typically consists of a small body with a long lower shadow and little or no upper shadow.
However, if you are asking about a hanging man candlestick in a downtrend, it is a bit unusual because the hanging man pattern typically appears in an uptrend. In a downtrend, you may see a similar pattern called a Hammer candlestick, which has a long lower shadow and a small real body.
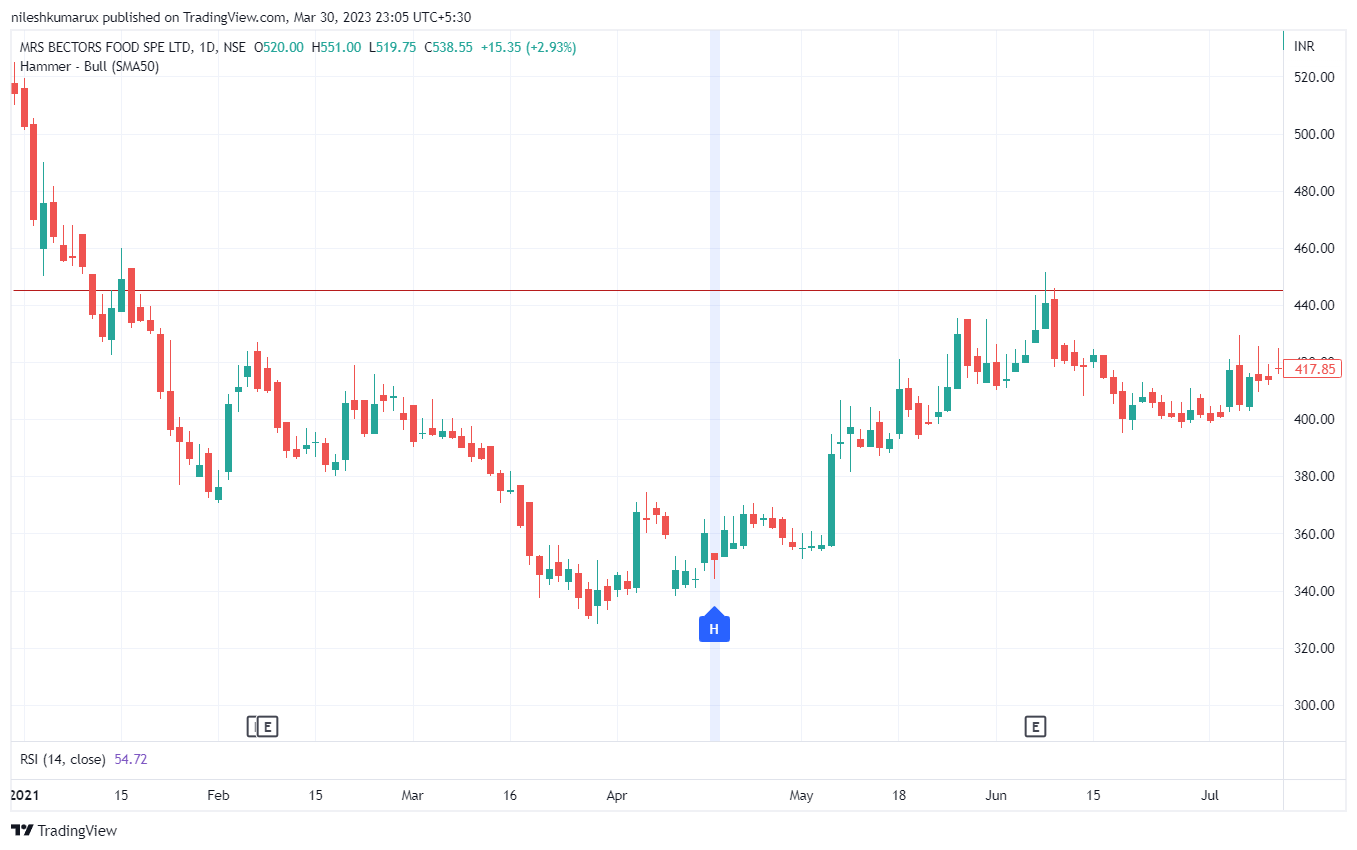
Hanging man candlestick in a downtrend example
Let’s see the chart for this pattern

Disclaimer: All comapny chart are used only for learing purpose. There is no buy and sell recommandtion. All Technical analyst are learing purpose only.