
A Long-legged Doji is a candlestick pattern that occurs when the opening and closing prices of an asset are close to each other. It showed volatility during the trading period, resulting in long upper and lower shadows.
See the image of the candlestick has a small body with long upper and lower wicks or shadows.
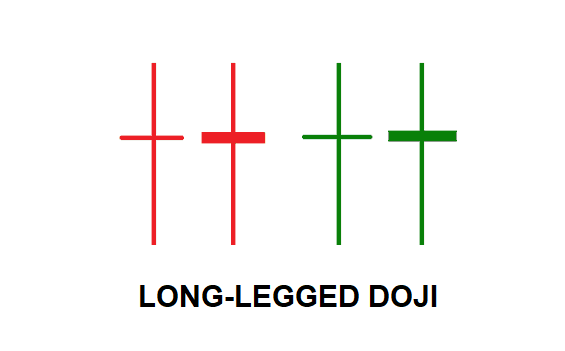
The Long-Legged Doji is a valuable signal at trend tops but the most case it is a neutral pattern and does not have a clear bullish or bearish bias. The excessive length of the shadows indicates massive indecision.
Long-legged doji examples
Here are Nifty index charts with this doji candle pattern.
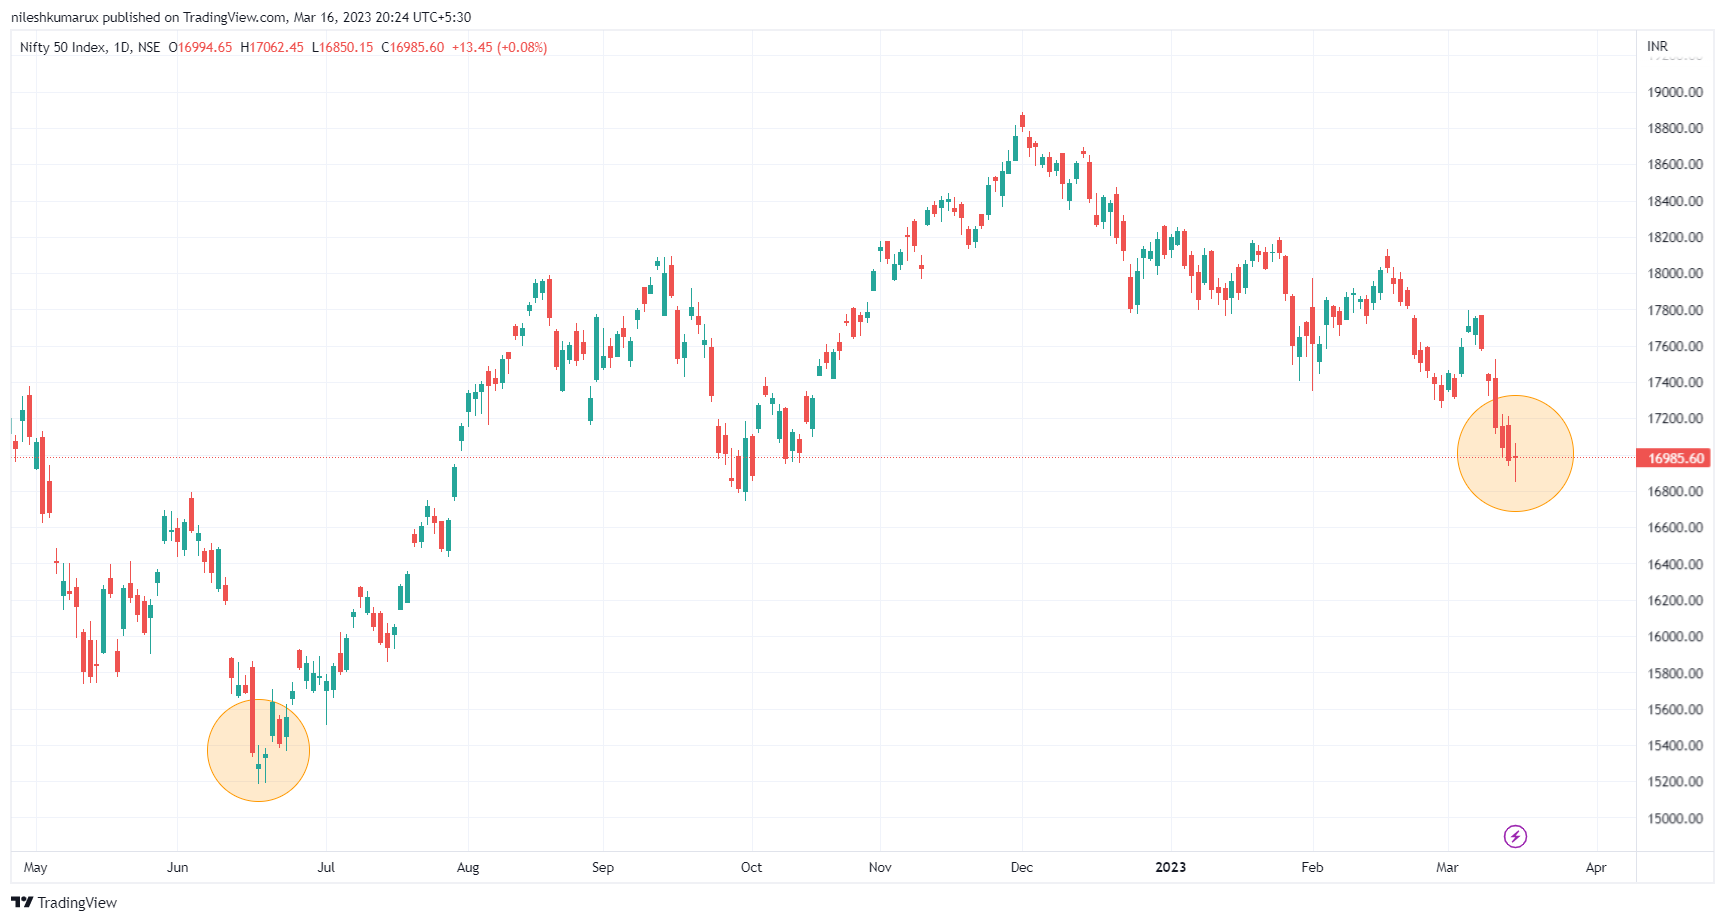
If the long-legged doji appears after a downtrend, it may signal a potential reversal, as the buyers and sellers are struggling to take control and the market may be approaching a bottom. On the other hand, if the pattern appears after an uptrend, it may indicate a potential reversal to the downside, as the buyers and sellers are struggling to maintain the bullish momentum.
Note: Traders should look for additional confirmation or technical tools before making a trading decision.
Do comment if you have any doubts or suggestions on this doji candlestick topic.
Disclaimer: All comapny chart are used only for learing purpose. There is no buy and sell recommandtion. All Technical analyst are learing purpose only.