
The gravestone Doji candlestick is a variation of the Inverted Hammer. It is formed when a stock’s open, close, and low prices are all at the same level, resulting in a long upper shadow and no lower shadow. This pattern indicates indecision in the market and a potential reversal of the current trend.
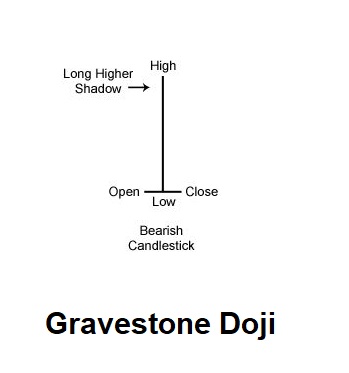
At the top of the trend, a Gravestone Doji is a specific version of the Shooting Star. At the bottom, it is a variation of the Inverted Hammer. This pattern implies that a bearish reversal is coming.
Gravestone Doji candlestick examples
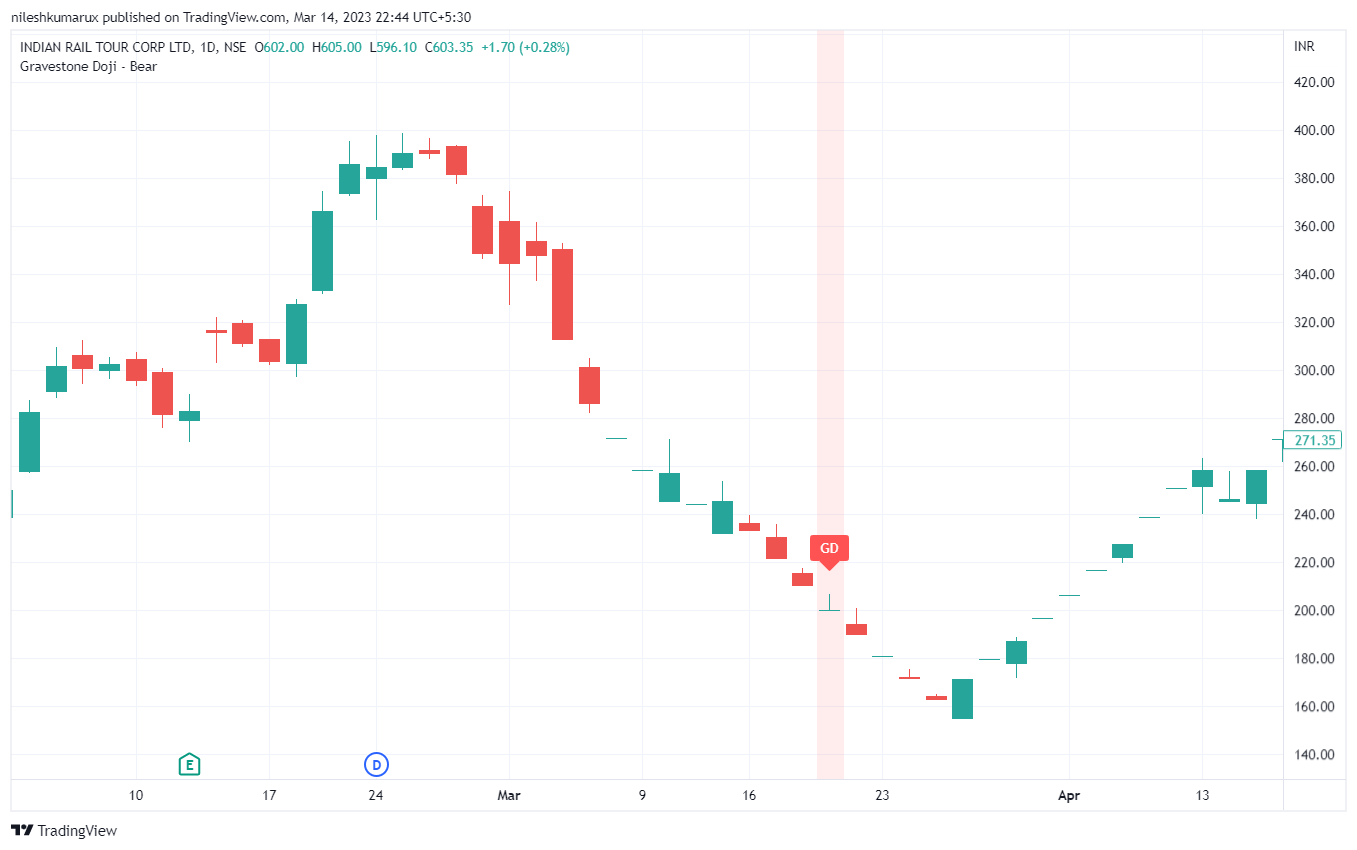
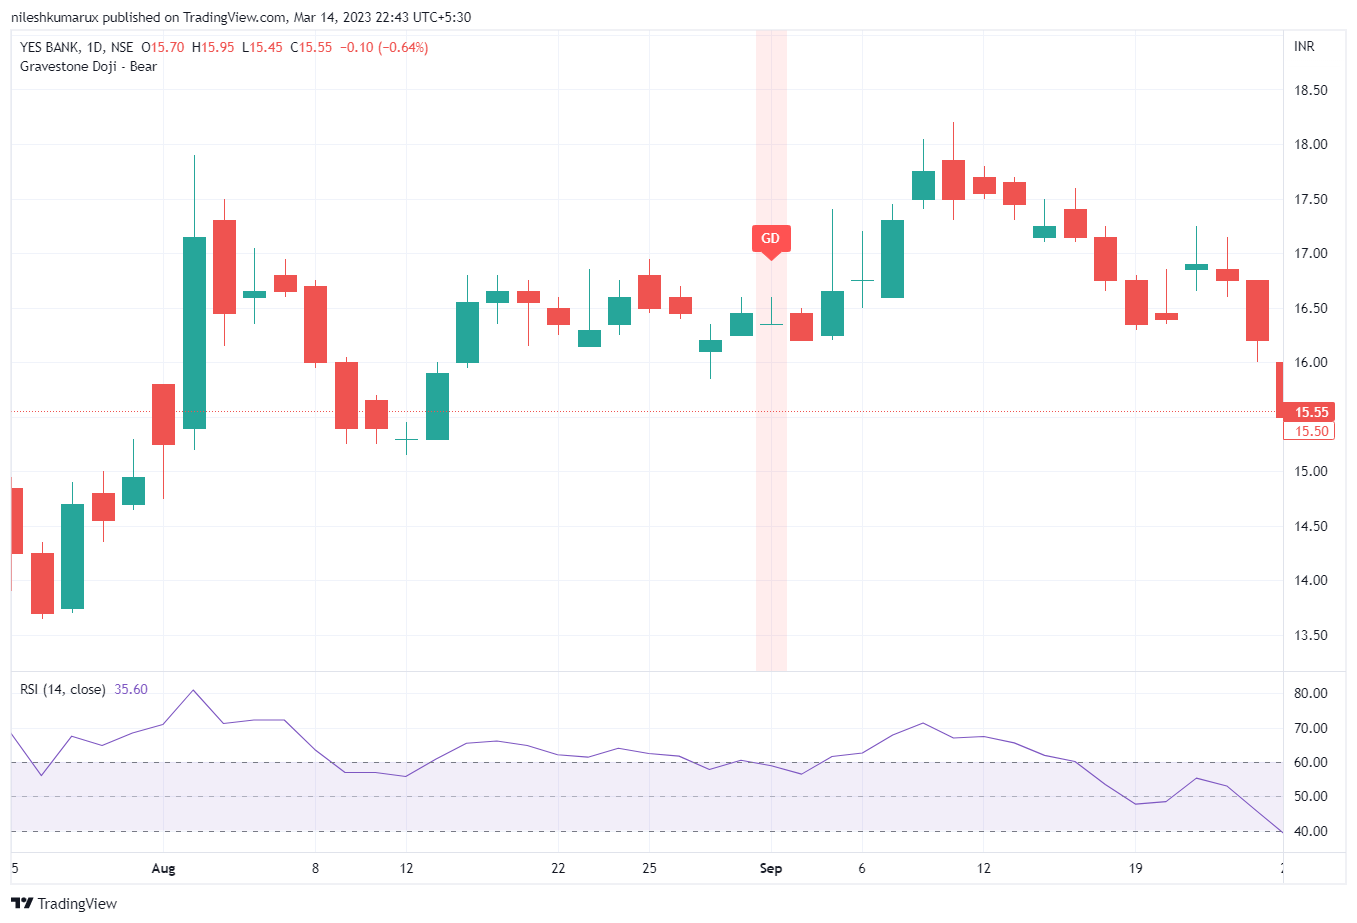
Here are some stock charts showing Gravestone Doji candle formation.
IRCTC CHART
YES BANK
Note: It is a bearish reversal pattern when it appears after an uptrend and a bullish reversal pattern when it appears after a downtrend. Take confirmation before making trading decisions, such as waiting for the next candle to close lower or higher than the gravestone doji.
Disclaimer: All comapny chart are used only for learing purpose. There is no buy and sell recommandtion. All Technical analyst are learing purpose only.